BTC TA for 08/27/2019
Good afternoon Steemians, how do you do?
In today's post I will do another technical analysis of the price of BTC, based on the classic tool of exponential moving averages, trend channels and RSI.
To perform this analysis, I used Binance's candlestick chart views for the 1 day, 1 week and 1 month respectively, along with the exponential average curves of 7, 21, 50 and 200 days, price trend channel. and RSI since 02/04/2019. That way I have a wider scope to be able to do a safer analysis with a larger historical series. It is worth remembering that this analysis aims at the medium and long term.
Exponential moving averages are the average prices for a given period of time, with the most recent period having the greatest weight in the construction of curves. Thus, in addition to providing a visualization of a trend, they react faster by taking into account short-term market price volatility.
7-day Exponential Moving Average (EMA 7): dark blue
21-day Exponential Moving Average (EMA 21): yellow
50-day Exponential Moving Average (EMA 50): Red
200-day Exponential Moving Average (EMA 200): turquoise blue
Trend Channel: Orange Lines
** PLEASE NOTE: THIS POST HAS ONLY AN EDUCATIONAL PURPOSE AND SHOULD NOT BE TAKEN AS A BASIS FOR INVESTMENT DECISIONS. THE ANALYSIS REFLECTS ONLY TO MY OPINION AND I AM NOT RESPONSIBLE FOR ANY GAIN OR LOSS OF OPERATIONS BASED ON THIS TECHNICAL PRICE ANALYSIS. **
Let's go!
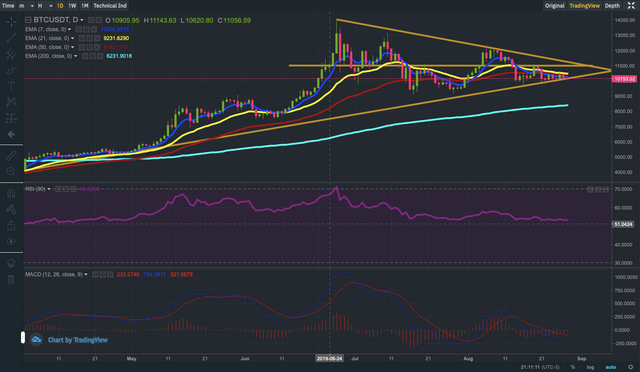
Image Source: binance.com
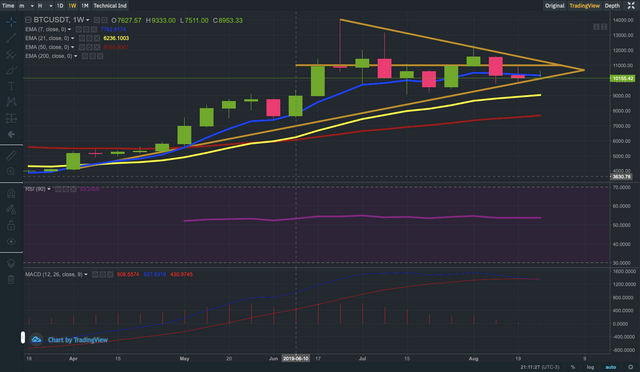
Image Source: binance.com
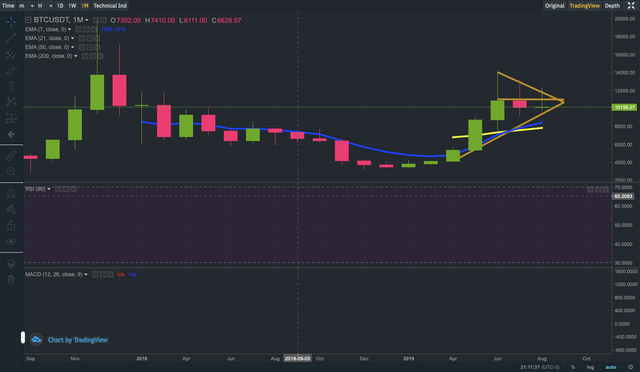
Image Source: binance.com
As you can see from the graphs above, the 7-day moving average is below EMA 21. This may indicate a price correction trend, as usually when short-term averages (EMA 7) are above other averages. Longer term this probably indicates a bullish flag in prices and when it crosses down we have the opposite. So as we have EMA 7 below EMA 21 we may still have some correction and price declines, although I believe that this correction (if any) should be quite small.
The RSI is lateralized around 53.03, which may indicate the completion of the recent correction we had in the last 19 days in BTC prices.
So here we have a somewhat confusing scenario, as long-term indicators indicate a rise, while short-term ones indicate a decline. This may translate into a possible continuation of the price correction trend that we can observe since 6/26/2019, when we hit the All Time Highs (ATH) of this last wave (but it was not the BTC's historic ATH).
Regarding the trend channel observed since 04/04/2019, we can say that the supports and resistances for 27 and 08/28/2019 are as follows respectively:
Supports:
Day 27 - USD $ 10,124.00
Day 28 - USD $ 10,141.00
Resistances:
Day 27 - USD $ 11,276.00
Day 28 - USD $ 11,239.00
The end of this trend channel (regardless of the type of visualization used) should occur between 02 and 10/09/2019, when then we should have a break and a clear direction of the market.
Did you like this content? Please help me maintain quality and regular posts by donating any amount in BTC, ETH or Doge to one of the portfolios below.
BTC wallet

ETH wallet

DOGE wallet:

STEEM wallet: @aotearoa
SBD wallet: @aotearoa
Together we can make #Steemit grow even stronger and faster!
Recent Posts:
Obrigado por postar! Esse comentário é o novo bot que dará upvote 1% para todos os posts que usam a tag #pt.