A Bit More About Thermal Cameras and the Images You Get With Them
This is a follow up on my post about thermal imaging cameras from yesterday as there is some more interesting information about these devices that I want to share. If you have missed the post from yesterday, then you can find it here: Thermal Imaging, Thermal Cameras, The Movie Predator and Now in Your Own Pocket. In it I cover some basic stuff about thermal imaging and thermal cameras and show some usage examples like in the movies from the Predator series and some more recent examples of use of thermal cameras in music videos to give them unique and interesting look and feel. Bow I'll be getting into a bit more detail on what kind of images a thermal camera produces and explain it to you how and why it is all a matter of interpreting that data and deciding how to show it visually...
How Does a Thermal Image Look Like
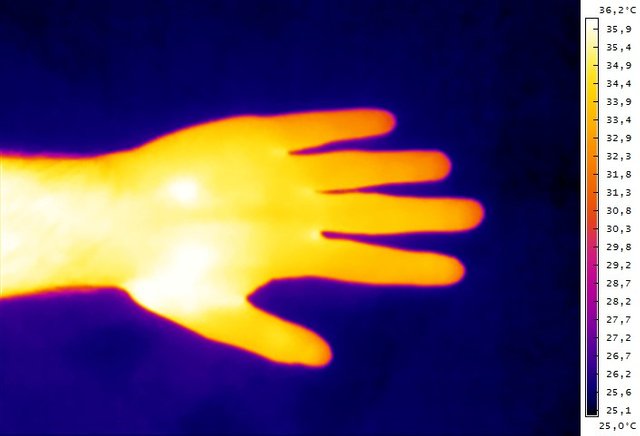
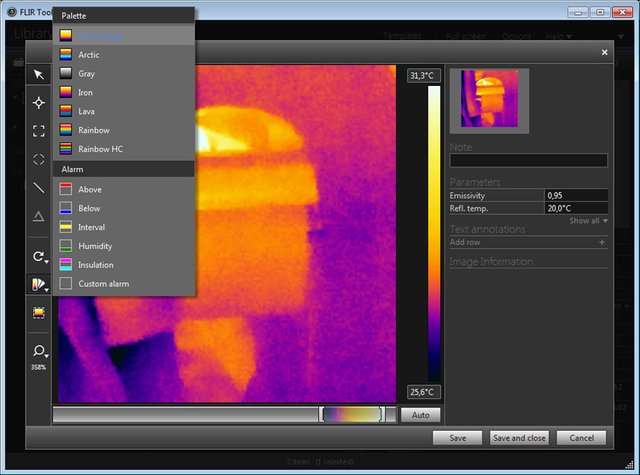
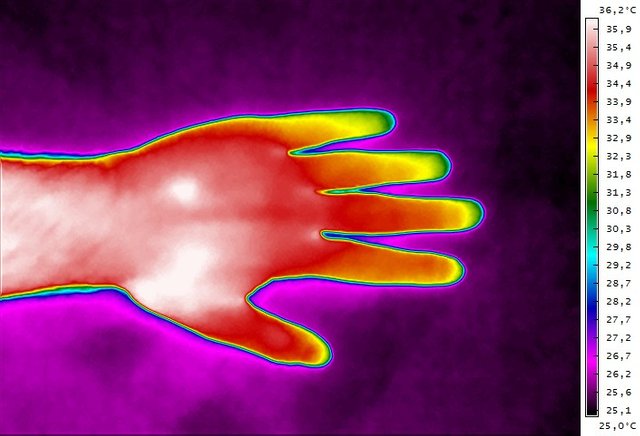
As I have already explained in my previous post the sensor of a thermal camera does not operate in the spectrum of visible light, but instead in a part of the infrared light and more specifically the Long-wavelength infrared region (LWI). This is the reason that these cameras do not record in color, though color is still used to make for a better and easier to read representation of the thermal data. Thermal cameras do record only temperature information for each pixel of the image they create instead of color information and then use software to turn that data in something visual and easy to understand and analyze. A special color palette is used with a different color mapped to a different temperature value and as a result you get a strangely looking image where different colors represent a different temperature. One of the most common such color palettes is called Iron and you can see a sample thermal image using this palette in the photo above, though this is not the only one. I'll get more into the different representations of thermal images in a moment, but first I want to talk about something else as well...
Since thermal cameras do not record visual information, but only thermal one, other the resulting image may not be very detailed and it can even be hard to recognize multiple objects on the image if they have closer surface temperatures. This is especially true if you are using a lower resolution thermal imager like in the case of most affordable consumer oriented thermal cameras. So as a means to make things look better and the lower resolution thermal image to look more like a higher resolution one there is an interesting trick being used to help. Thermal camera manufacturers add a second camera that works in the visual light spectrum, just like the camera on your smartphone, that has a higher resolution than the thermal one and they combine the two images to produce a better looking thermal image as if it was recorded with a higher resolution.
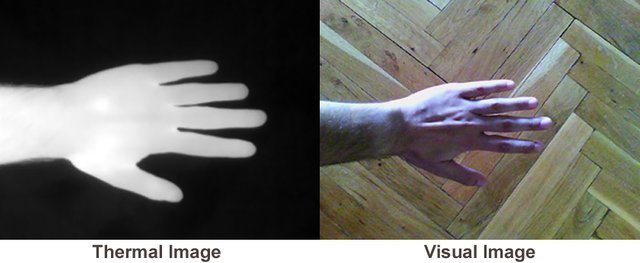
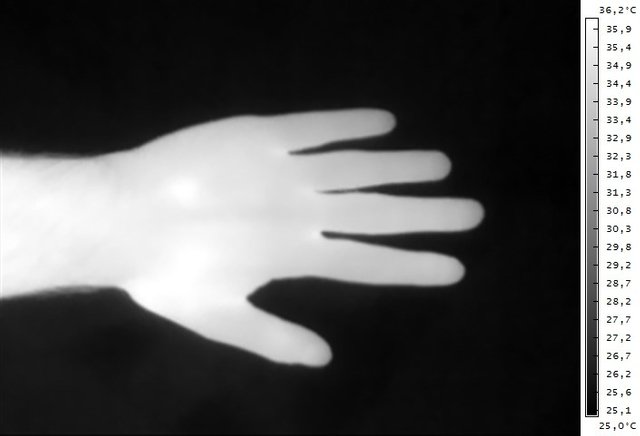
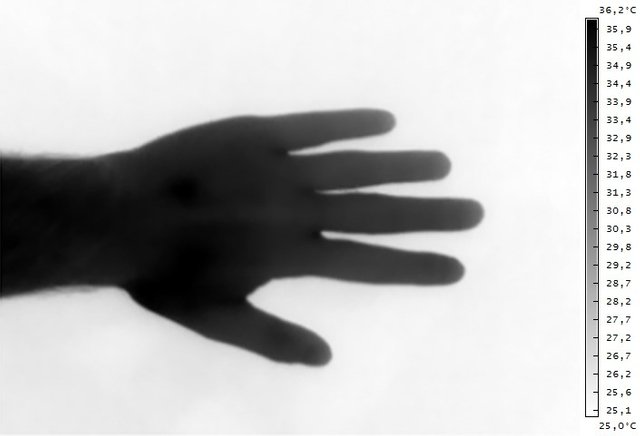
On the image above you can see a monochrome representation on how a thermal image may look like, and next to it how a visual camera of the same thing (my hand in this example) can look like. These two images are recorded by the two different sensors on the same FLIR thermal camera with the visual image actually being double the resolution of the thermal sensor. Do note that even the monochrome representation of the thermal data on the left is just that, a representation of the thermal data in a visual way with false colors (black to white - colder to hotter), the same as when using different colors for different temperatures with other color palettes such as the Iron one mentioned already.
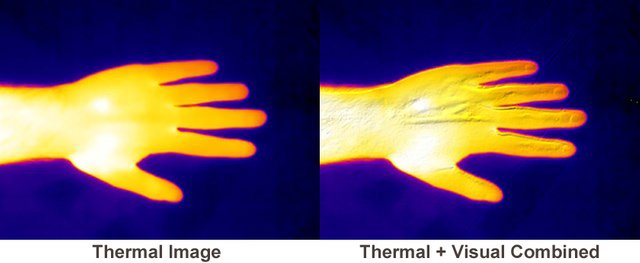
So what happens when we combine the thermal image with the visual one, normally a bit of a mess, though if we take only the contours of objects from the visual image and superimpose them on top of the thermal image we get more of what we need. We are essentially improving the visual detail of the thermal image making it easier to distinguish details and objects on the image without diluting too much the visual representation of the thermal information. Of course there are some other ways to help us combine the data of the two camera sensors in order to make things more useful for the person that will be analyzing the thermal information.
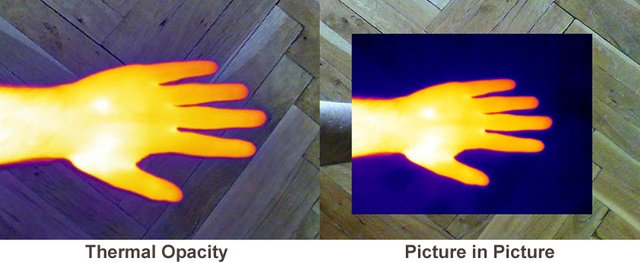
You can also get thermal fusion with opacity or even a picture in picture mode for combining the two different sets of information - visual and thermal. In the first image we are fusing the two images with the thermal one being with some opacity to show the visual image in the background with enough details. The second image just puts the two images in a picture in picture mode with the higher resolution visual image as a background and the lower resolution thermal one on top in the center. It is up to the user to decide which one of these different methods works best in each case and will be more useful for analyzing the thermal information when needed. If you have the original thermal image you can always generate any kind of the available visual representations, however that may not always be the case as you might just be looking at a report with some resulting photos and without the actual thermal data and tools available for you.
False Color Representations of Thermal Images
There is a number of commonly used color palettes that have been named specifically being used for representing the thermal information from a thermal camera in a visual way. You have already seen examples of the most commonly used color palettes - the Iron and the Grayscale ones, but there are some more you can also see being used less often. For example in the movie Predator that I have used as an example in my previous post a variation of the Rainbow color palette has been used to represent different temperatures in the thermal image. Aside from it you may see the Arctic or Lava color palettes used as well and even some custom combinations as it is not that hard to create your own color palette to use.
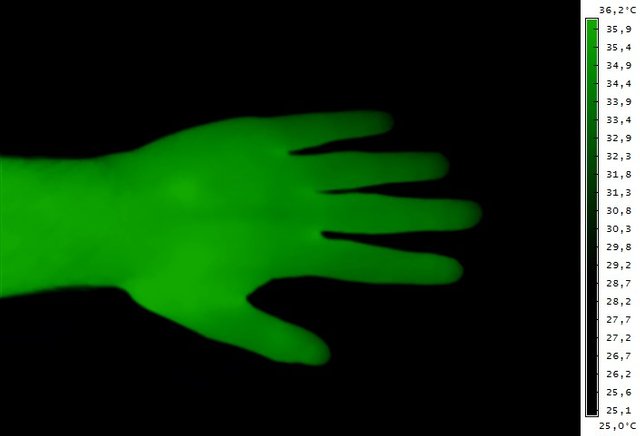
Here is an example that I have made with a custom color palette that essentially goes from black for colder areas to brighter green for hotter ones... and there you have it a green strange looking hand on an image that represents thermal data. The key thing that you need in being able to analyze the visual information that you see, regardless of the color palette used, is to have a color-temperature chart like the one on the right. Without such a color chart to tie the temperature to a certain color value it is really hard to do a proper analysis of the thermal information. Just imagine using the Grayscale color palette, but reversing it and using black for hotter elements and white for colder instead... if you don't know that and assume it is a regular Grayscale representation you will be getting confusing results.

Iron color palette
Grayscale color palette
Grayscale REVERSE color palette
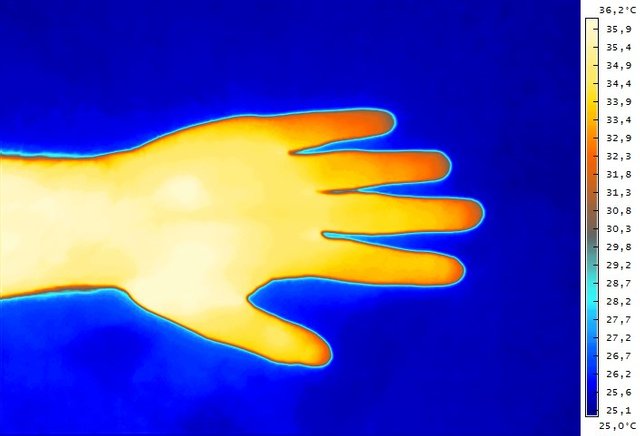
Arctic color palette
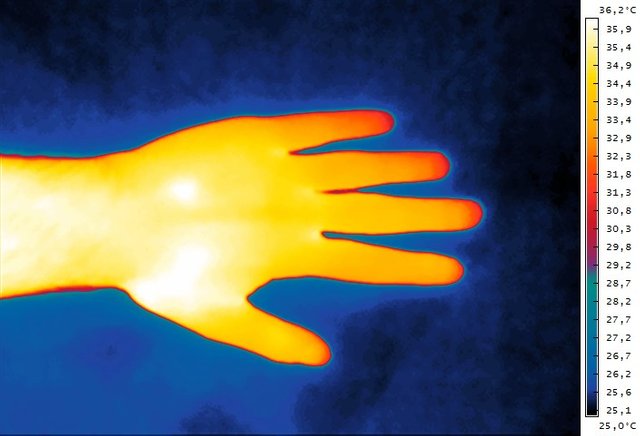
Lava color palette
Rainbow color palette
Rainbow High Contrast color palette
If you have a question or want to add something, then please leave a comment below.
Did you like what you have just read? Check my other posts on steemit @cryptos
If you like what I'm doing for Steem and on Steemit you can support me as a Witness
Pretty looking pictures, and interesting info.
Thanks. :-)
This post has been linked to from another place on Steem.
Learn more about linkback bot v0.4. Upvote if you want the bot to continue posting linkbacks for your posts. Flag if otherwise.
Built by @ontofractal
Awesome post--thanks for sharing! So cool to have so many camera options nowadays. Any recommendations for an ids camera, such as this one?