Introductory Work on Section Based Page View of Web Contents: Towards The Idea of How a Page is Viewed
Author
Fajar Purnama, Alvin Fungai, Thinh Minh Do, Al Hafiz Akbar Maulana Siagan, Anwar Annas, Harry Susanto, Hendarmawan, Tsuyoshi Usagawa, Hiroshi Nakano.
Note
- This paper was presented at 11th International Student Conference on Advanced Science and Technology (ICAST) in Kumamoto University, Japan, on 9th December 2016 but was not published thus the copyright remained with me "Fajar Purnama" the main author where I have the authority to repost anywhere and I hereby declare to license it as customized CC-BY-SA where you are also allowed to sell my contents but with a condition that you must mention that the free and open version is available here. In summary, the mention must contain the keyword "free" and "open" and the location such as the link to this content.
- The original is available at Reasearch Gate.
- The presentation is available at Slide Share.
- The source code is available at Github.
Abstract
Many researchers had used the page view feature to identify the behavior of online users. Evaluators on e-learning for example used content views, quiz attempts, and scores to analyze the students' performance. However, these data still lacks some details compare to thorough face to face evaluation. The data can answer what, when, and where, but cannot answer how a page is viewed. To answer that question it is needed to track as detail as the page section level. This introductory work shows a path to that answer by demonstrating tracking of the date and duration viewed of a HTML page section using Javascript. This extended feature will open up new possibilities for those researching the behaviors of online users alike.
Introduction
With today's information communication technology (ICT) it is very common for people to publish information online which can be viewed anywhere at anytime unlike the conventional hard copies such as books. This made a possibility for web page analytics (i.e. how long and how many times that page is viewed). These features greatly benefit the field of education, and birth popular terms like e-learning, online course, and learning analytic.
Our colleges [1] [2] implemented e-learning on their respective universities and some schools, and they were able to monitor their students' performances at ease which were essential data for their research. Research in [3] focuses on the online discussion forums of students and distinguished between non-active, lurkers, and active students through the number of posts and post views. Another research in [4] shows the differences in learning patterns between students below and above average. Their research were able to greatly improve the quality of education, however their types of data still only consists to the likes of number of contents viewed, discussions posted, assignments submitted, quizzes attempted, and their scores, which still has not shown the detail behaviors or habits of those during face to face interaction. In simple terms, the data can answer what, when, and where the contents were viewed but cannot answer how the contents were viewed.
The authors have the idea to extend the details of the data that can be collected like what part of the page is the person currently focusing on, how long did the user spend on that part, how many times did the user click, how often did the user scroll up and down, what did the user type, and other users interactions. Due to the limitation of this paper will only be shown a glimpse of this idea as stated on title of this article as introductory. This work will show that a client-side programming can be implemented on a web page to measure the time spent by a user on that particular section along with the accessed date. Thus the objective of this work is to demonstrate a web application that can track the date and duration viewed on sections of a page.
Related Work
A related work that most people know is the browser history that contains what site and when we have previously visited. Projects in the ICT industry had built analytic tools for example TimeStat [5] a Chrome Browser plugin that can generate statistical graph alike that represents our browsing behavior including when and how long we spent on a page. A more advance tool example is Google Analytics [6] that could capture various user interaction such as mouse clicks, mouse scrolls, keyboard types, image viewed, videos played, and etc.
There are also other works by researchers on learning analytics field. One of our colleges [7] on his open textbook analytic system framework was able to record students actions such as movements to a next/previous page, jumps to a chapter, link clicks, bookmarks and annotations, [8] is also very similar that claims to be able to identify reader’s reading habit on e-magazines, but both had not dive as far as this work's proposed state of the art which is tracking sections viewed on a page. One of the closest to this work is from [9] which they built a finger trail learning system (FTLS) where the users must scroll to every letters on the reading context. The letters will be highlighted once the pointer touches the letter. The work is very similar and maybe better but not the same. They introduces users reading habit by pointer trailing, while this work is about the time spent by users reading on particular sections.
Application Architecture
The application architecture can be seen in Fig. 1. It consists of a representation interface, a web application program interface (API), and a database. The state of the art proposed method is on the representation side where a client-side programming is embedded on a web page to record the section page view event by the user. The other parts are web API and database to store, analyze and present the captured events which is common knowledge. The web API is a server-side programming language that can be Java, hypertext preprocessor (PHP), or any other languages that functions to put the captured events on the database, retrieve and present the data. Advanced analysis can be done on this side to represent the data statistically like in form of line graph for example. Finally the database is a place to store the captured events, which usually use query languages such as structured query language (SQL). The database can either be MySQL, MariaDB, or other known database applications.
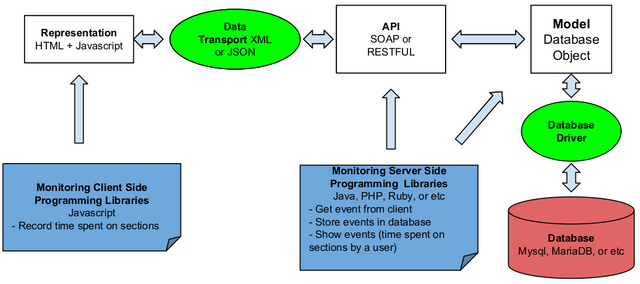
Fig. 1. Application Architecture
The prototype on this introductory work is a hyper text markup language (HTML) page embedded with a Javascript as the client-side programming language on the representation side. Due to the limited space of this work, it is presented only the part that could capture user's reading session on a particular section on List. 1. This introductory work relies on the mouse pointer or cursor as indicator of where the user is currently focusing. Sectioning is done by "div" tags, "onmouseenter" is a variable to execute function "startCount" to start the timer when a mouse pointer enters the section, and "onmouseleave" is a variable to execute function "stopCount" to stop the timer when a mouse pointer leaves the section. The parameter “sect” inside each functions is to separate the output (duration, etc) for that particular section only. It is unfortunate that it cannot be revealed the timer Javascript function here, but it is a slight modification of [10]. Each sections are covered by "form" tags and as the mouse leaves the section ("onmouseleave") will submit the values user identification, the section, date, and duration of view to the web API. The web API will store those values to the database and can also view those store values. The web API is written in Java Servlet, uses Java Database Connectivity (JDBC), and the database uses MySQL. The full source code is available on [11] on GitHub, there we also provide a source code on another branch where the sectioning of “div” and “form” tags are added automatically. Currently it is a separate Javascript code to detect “H1” (header) tags on a HTML file and put the section’s contents as child node on the sectioning tags “div” and “form”.
List. 1. Tracker code example on a section of a text
<form id=“sect” action="thewebAPI" onmouseleave="submitFunction(sect)">
<div id=”sect” onmouseenter="startCount(sect)"  onmouseleave="stopCount(sect)">
<h1> Section 1 </h1>
<input type="hidden" id="value">
<p>  This is section 1.  </p>
</div> </form>
Demonstration
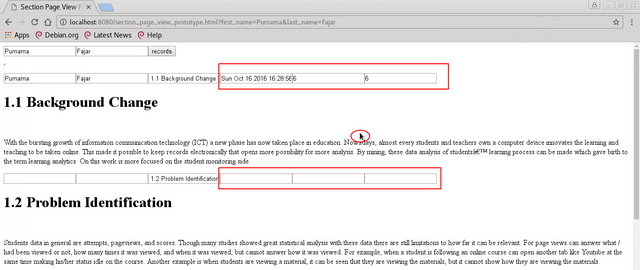
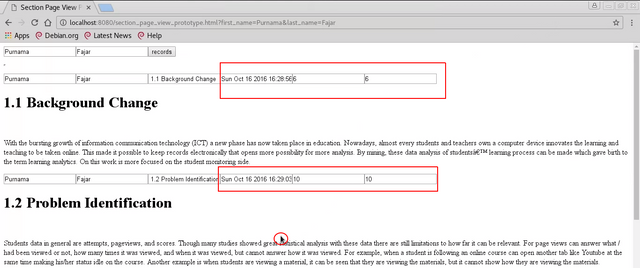
Fig. 2. Demonstration, left focus on section 1.1, right focus on section 1.2
Fig. 2. is a view of List. 1. The left figure shows that the timer starts when the mouse pointer is in the first section. Afterwards it stops when leaving section 1 and starts timer on section 2 when it enters it on the right figure. For both sections, the dates of the last time pointed by the pointer is also generated. Therefore Figure Fig. 2. demonstrate the possibility of tracking the time spent by a user on a particular section. Using a web API and a database can store and output the result, revealing when and how long a user spent on certain sections of the page as on Fig. 3.
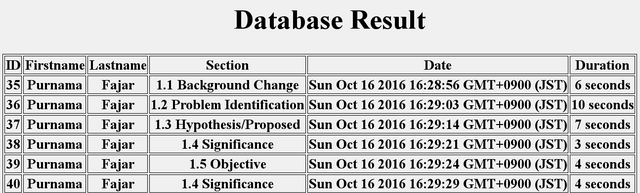
Fig. 3. Sample result showing the date and duration spent on certain sections
Conclusion and Future Work
This introductory work demonstrated an application that could track the date and time spent on certain sections of a web page which will be an extended feature of currently existing page views feature. The data that can be obtained from this feature allows new possibility to those who researches the behaviors of users online, and may benefit those in the field of e-learning alike. On the next work will be implementing a module or plugin to content editors on content management systems (CMS) and learning management system (LMS) to provide a button to add this tracking feature on their contents. However, this may not be suitable for commercial use since the coding nature of web pages can be complicated and variative to implement this method. It is suggested in future work to develop a browser plugin that can track the window of the browser itself instead of the web pages.
Reference
- S. Paturusi, Y. Chisaki, and T. Usagawa, “Assessing lecturers and student’s readiness for e-learning: A preliminary study at national university in north sulawesi indonesia,” GSTF Journal on Education (JEd), vol. 2, no. 2, pp. 1–8, 2015.
- H. T. Sopu, Y. Chisaki, and T. Usagawa, “Use of facebook by secondary school students at nuku’alofa as an indicator of e-readiness for e-learning in the kingdom of tonga,” International Review of Research in Open and Distributed Learning, vol. 17, no. 4, pp. 203–223, 2016.
- D. Nandi, M. Hamilton, J. Harland and G. Warburton, “How Active are Students in Online Discussion Forums?,” In Proc. Thirteenth Australasian Computing Education Conference (ACE 2011)., pp. 125-134.
- M. Wen and C. P. Rosé, “Identifying Latent Study Habits by Mining Learner Behavior Patterns in Massive Open Online Courses,” In Proc. 23rd ACM International Conference on Conference on Information and Knowledge Management., pp. 1983-1986.
- timestats. [Online]. Available: https://chrome.google.com/webstore/detail/timestats/ejifodhjoeeenihgfpjijjmpomaphmah. [Accessed 10 October 2016]
- Adding analytics.js to your site. [Online]. Available: https://developers.google.com/analytics/devguides/collection/analyticsjs. [Accessed 10 October 2016]
- D. Prasad, R. Totaram, and T. Usagawa, “A framework for open textbooks analytics system,” TechTrends, vol. 60, no. 4, pp. 344–349, 2016.
- R. S. T. Lee, J. N. K. Liu, K. S. Y. Yeung, A. H. L. Sin and D. T. F. Shum, “Agent-based Web Content Engagement Time (WCET) Analyzer on e-Publication System,” In Proc. 2009 Ninth International Conference on Intelligent Systems Design and Applications., pp. 67-72.
- K. Maruya, J. Watanabe, H. Takahashi and S. Hashiba, “A learning system utilizing learners’ active tracing behaviors,” In Proc. Fifth International Conference on Learning Analytics And Knowledge., pp. 418-419. [10] Window settimeout() method. [Online]. Available: http://www.w3schools.com/jsref/met_win_settimeout.asp. [Accessed 10 October 2016]
- Section based page view. [Online]. Available: https://github.com/0fajarpurnama0/Section_Based_Page_View. [Accessed 10 October 2016]
Mirror
- https://www.publish0x.com/0fajarpurnama0/introductory-work-on-section-based-page-view-of-web-contents-xejryvl?a=4oeEw0Yb0B&tid=steemit
- https://0fajarpurnama0.github.io/masters/2020/05/24/introductory-section-based-page-view
- https://medium.com/@0fajarpurnama0/introductory-work-on-section-based-page-view-of-web-contents-towards-the-idea-of-how-a-page-is-2dc4888ed450
- https://hicc.cs.kumamoto-u.ac.jp/~fajar/masters/introductory-section-based-page-view
- https://0fajarpurnama0.tumblr.com/post/618959931758067712/introductory-work-on-section-based-page-view-of
- https://0darkking0.blogspot.com/2020/05/introductory-work-on-section-based-page.html
- https://0fajarpurnama0.cloudaccess.host/index.php/uncategorised/41-introductory-work-on-section-based-page-view-of-web-contents-towards-the-idea-of-how-a-page-is-viewed
- http://0fajarpurnama0.weebly.com/blog/introductory-work-on-section-based-page-view-of-web-contents-towards-the-idea-of-how-a-page-is-viewed
- https://0fajarpurnama0.wixsite.com/0fajarpurnama0/post/introductory-work-on-section-based-page-view-of-web-contents-towards-the-idea-of-how-a-page-is-view
This post has been rewarded by the Steem Community Curation Project. #communitycuration07