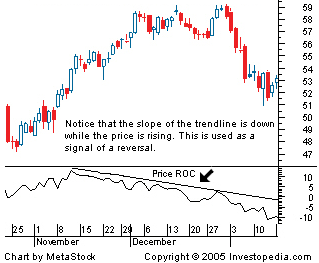
What is ROC - Rate Of Change?
The price rate of change (ROC) is a technical indicator of momentum that measures the percentage change in price between the current price and the price n periods in the past. It is calculated by using the following formula:
ROC = (Most recent closing price – Closing price n periods ago) / Closing price n periods ago x 100
 BREAKING DOWN ‘Price Rate Of Change – ROC’
The ROC is classed as a momentum or velocity indicator because it measures strength of price momentum by the rate of change. For example, if a stock’s price at the close of trading today is $10, and the closing price five trading days prior was $7, then the ROC over that time frame is approximately 43, calculated as (10 – 7 / 7) x 100 = 42.85.
Using the Price Rate of Change Indicator
Like most momentum oscillators, the ROC appears on a chart in a separate window below the price chart. The ROC is plotted against a zero line that differentiates positive and negative values. To traders, positive values indicate upward buying pressure or momentum, while negative values below zero indicate selling pressure or downward momentum. Increasing values in either direction, positive or negative, indicate increasing momentum, and decreasing values indicate waning momentum.
Traders and market analysts use the ROC in different ways. In addition to being used as a general trend or trend strength indicator, the ROC is also commonly used as a divergence indicator that signals a possible upcoming trend change. Divergence occurs when the price of a stock or another asset moves in one direction while its ROC moves in the opposite direction. For example, if a stock’s price is rising over a period of time when its ROC values are below the zero line and moving to progressively greater negative values, then the ROC is indicating bearish divergence from price, which signals a probable trend change to the downside.
The ROC is also sometimes used to indicate overbought or oversold conditions for a security. Positive values that are greater than 30 are generally interpreted as indicating overbought conditions, while negative values lower than negative 30 indicate oversold conditions.
One potential problem with using the ROC indicator is that its calculation gives equal weight to the most recent price and the price from n periods ago, despite the fact that most technical analysts consider more recent price action to be of more importance in determining likely future price movement.
Full credits for this article to [investopedia.com](http://Full credits for this article to investopedia.com | This article has been sourced from: http://www.investopedia.com) | This article has been sourced from: http://www.investopedia.com/terms/p/pricerateofchange.asp
