What is ADX? The Trend Strength Indicator
ADX is plotted as a single line with values ranging from a low of zero to a high of 100. ADX is non-directional; it registers trend strength whether price is trending up or down. The indicator is usually plotted in the same window as the two directional movement indicator (DMI) lines, from which ADX is derived (Figure 1).
For the remainder of this article, ADX will be shown separately on the charts for educational purposes.
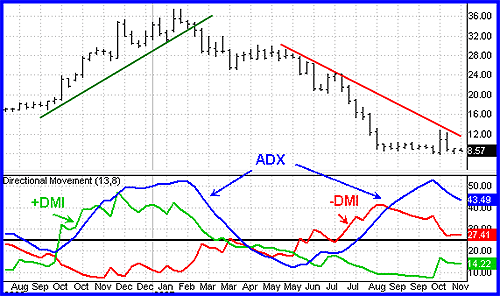 Source: TDAmeritrade Strategy DeskFigure 1: ADX is nondirectional and quantifies trend strength by rising in both uptrends and downtrends.When the +DMI is above the -DMI, prices are moving up, and ADX measures the strength of the uptrend. When the -DMI is above the +DMI, prices are moving down, and ADX measures the strength of the downtrend. Figure 1 is an example of an uptrend reversing to a downtrend. Notice how ADX rose during the uptrend, when +DMI was above -DMI. When price reversed, the -DMI crossed above the +DMI, and ADX rose again to measure the strength of the downtrend.
Quantifying Trend Strength
ADX values help traders to identify the strongest and most profitable trends to trade. The values are also important for distinguishing between trending and non-trending conditions. Many traders will use ADX readings above 25 to suggest that the trend’s strength is strong enough for trend trading strategies. Conversely, when ADX is below 25, many will avoid trend trading strategies.
ADX Value****Trend Strength0-25Absent or Weak Trend25-50Strong Trend50-75Very Strong Trend75-100Extremely Strong TrendLow ADX is a usually a sign of accumulation or distribution. When ADX is below 25 for more than 30 bars, price enters range conditions and price patterns are often easier to identify. Price then moves up and down between resistance and support to find selling and buying interest, respectively. From low ADX conditions, price will eventually break out into a trend. In Figure 2, price moves from a low ADX price channel to an uptrend with strong ADX.
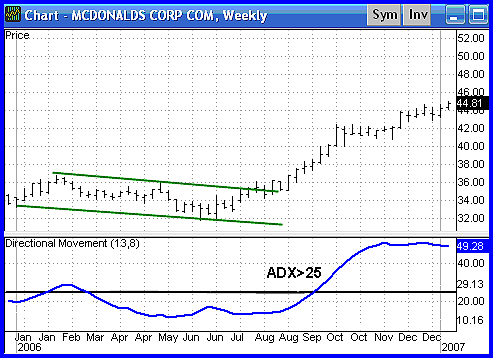 Source: TDAmeritrade Strategy DeskFigure 2: When ADX is below 25, price enters a range. When ADX rises above 25, price tends to trend.
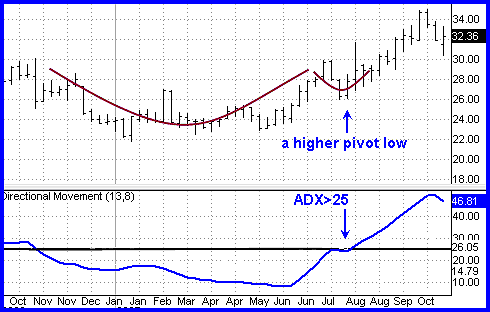 Source: TDAmeritrade Strategy DeskFigure 3: Periods of low ADX lead to price patterns. This chart shows a cup and handle formation that starts an uptrend when ADX rises above 25.The direction of the ADX line is important for reading trend strength. When the ADX line is rising, trend strength is increasing and price moves in the direction of the trend. When the line is falling, trend strength is decreasing, and price enters a period of retracement or consolidation. (For more on this topic, check out Retracement Or Reversal: Know The Difference.)
A common misperception is that a falling ADX line means the trend is reversing. A falling ADX line only means the trend strength is weakening, but it usually does not mean the trend is reversing unless there has been a price climax. As long as ADX is above 25, it is best to think of a falling ADX line as simply less strong (Figure 4).
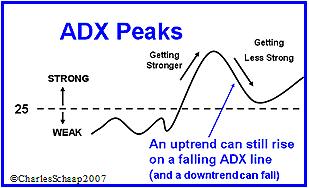 Source: TDAmeritrade Strategy DeskFigure 4: When ADX is below 25, the trend is weak. When ADX is above 25 and rising, the trend is strong. When ADX is above 25 and falling, the trend is less strong.Trend Momentum
The series of ADX peaks are also a visual representation of overall trend momentum. ADX clearly indicates when the trend is gaining or losing momentum. Momentum is the velocity of price. A series of higher ADX peaks means trend momentum is increasing. A series of lower ADX peaks means trend momentum is decreasing. Any ADX peak above 25 is considered strong, even if it is a lower peak. In an uptrend, price can still rise on decreasing ADX momentum because overhead supply is eaten up as the trend progresses (Figure 5).
 Source: TDAmeritrade Strategy DeskFigure 5: ADX peaks are above 25 but getting smaller. The trend is losing momentum but the uptrend remains intact.Knowing when trend momentum is increasing gives the trader confidence to let profits run instead of exiting before the trend has ended. However, a series of lower ADX peaks is a warning to watch price and manage risk. The best trading decisions are made on objective signals, not emotion.
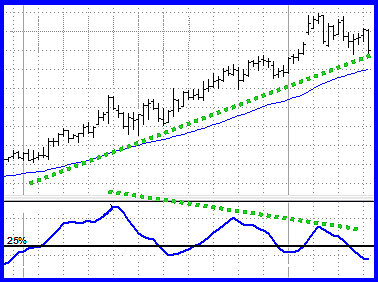
ADX can also show momentum divergence. When price makes a higher high and ADX makes a lower high, there is negative divergence, or nonconfirmation. In general, divergence is not a signal for a reversal, but rather a warning that trend momentum is changing. It may be appropriate to tighten the stop-loss or take partial profits. (For related reading, check out Divergences, Momentum And Rate Of Change.)
Any time the trend changes character, it is time to assess and/or manage risk. Divergence can lead to trend continuation, consolidation, correction or reversal (Figure 6).
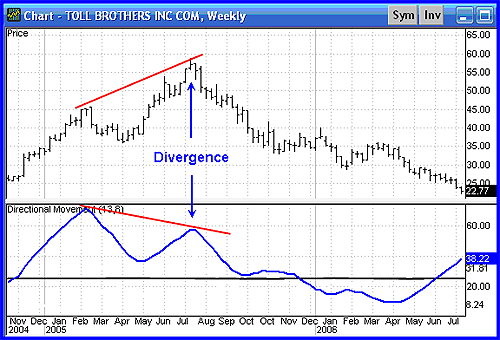 Source: TDAmeritrade Strategy DeskFigure 6: Price makes a higher high while ADX makes a lower high. In this case, the negative divergence lead to a trend reversal.Strategic Use of ADX
Price is the single most important signal on a chart. Read price first, and then read ADX in the context of what price is doing. When any indicator is used, it should add something that price alone cannot easily tell us. For example, the best trends rise out of periods of price range consolidation. Breakouts from a range occur when there is a disagreement between the buyers and sellers on price, which tips the balance of supply and demand. Whether it is more supply than demand, or more demand than supply, it is the difference that creates price momentum.
Breakouts are not hard to spot, but they often fail to progress or end up being a trap. But ADX tells you when breakouts are valid by showing when ADX is strong enough for price to trend after the breakout. When ADX rises from below 25 to above 25, price is strong enough to continue in the direction of the breakout.
ADX as a Range Finder
Conversely, it is often hard to see when price moves from trend to range conditions. ADX shows when the trend has weakened and is entering a period of range consolidation. Range conditions exist when ADX drops from above 25 to below 25. In a range, the trend is sideways and there is general price agreement between the buyers and sellers. ADX will meander sideways under 25 until the balance of supply and demand changes again. (For more see, Trading Trend Or Range?)
ADX gives great strategy signals when combined with price. First, use ADX to determine whether prices are trending or non-trending, and then choose the appropriate trading strategy for the condition. In trending conditions, entries are made on pullbacks and taken in the direction of the trend. In range conditions, trend trading strategies are not appropriate. However, trades can be made on reversals at support (long) and resistance (short).
Bottom Line: Finding Friendly Trends
The best profits come from trading the strongest trends and avoiding range conditions. ADX not only identifies trending conditions, it helps the trader find the strongest trends to trade. The ability to quantify trend strength is a major edge for traders. ADX also identifies range conditions, so a trader won’t get stuck trying to trend trade in sideways price action. In addition, it shows when price has broken out of a range with sufficient strength to use trend trading strategies. ADX also alerts the trader to changes in trend momentum, so risk management can be addressed. If you want the trend to be your friend, you’d better not let ADX become a stranger.
Full credits for this article to [investopedia.com](http://Full credits for this article to investopedia.com | This article has been sourced from: http://www.investopedia.com) | This article has been sourced from: http://www.investopedia.com/articles/trading/07/adx-trend-indicator.asp

nice statistics.
Thank you for the great guide https://9blz.com/adx-indicator-explained/