Technical Analysis on Bitcoin: Major Move May be Coming

Bitcoin's been operating within a wedge for the past few days. It looks like a breakout, either up or down, is coming at any moment.
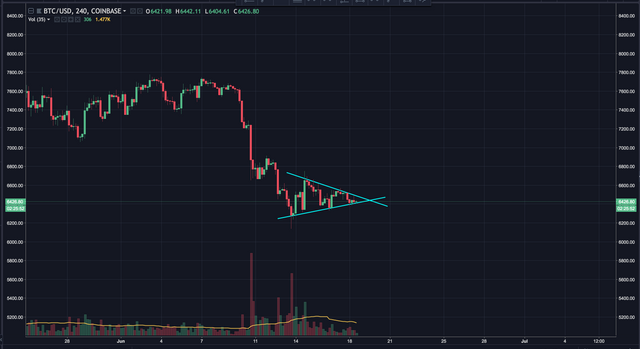
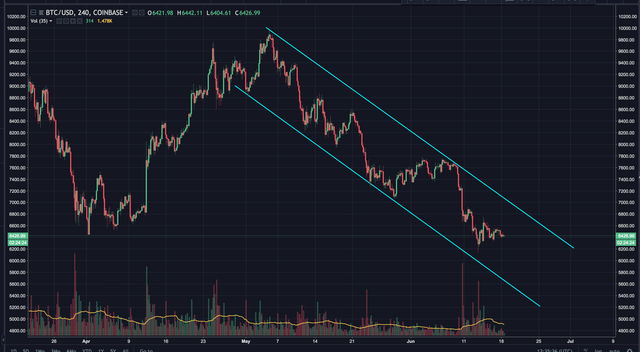
Zooming out, we can see it's also been operating within a channel since early May. A break above or below this channel may signify a major bullish or bearish trend to follow.
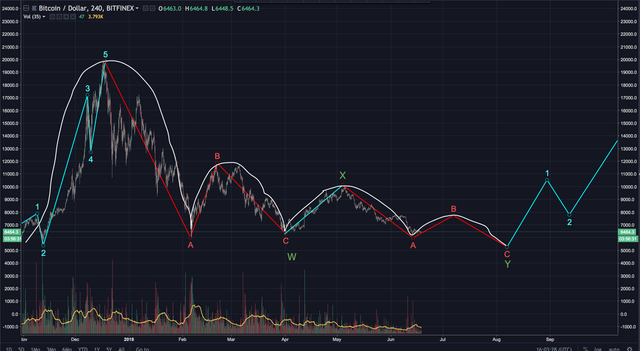
Should bitcoin break up decisively, it may mean it's in a WXY pattern. If correct, wave A would be complete with wave B just getting started.
Zooming out on the 4 hour, We can see the pattern bitcoin's followed since it's $20K high. It's had a major rise, followed by a massive drop, followed by a smaller rally, then smaller drop, and so on. We can see the rallies and dips are becoming further spaced apart. I'd expect this ABC correction to continue that pattern until we see a major influx of volume to break it. There's massive support at $7K and again at $7,700. I don't believe wave B will go any higher unless we see volume increases. Here's how It may play out:
A more bearish count has bitcoin in 5 waves down. If this is accurate, wave 4 is just completing, with wave 5 yet to come. A logical target for wave 5 would be the 1.0 fib, or about $5,060. Here's how that might look:
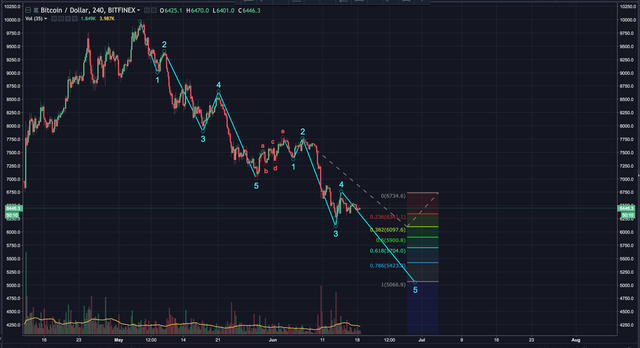
There is strong support between $6K and $5,800. It's possible we may see a truncated 5th wave at those levels, followed by a rally, or more consolidation. I'll discuss more if/when it gets there.
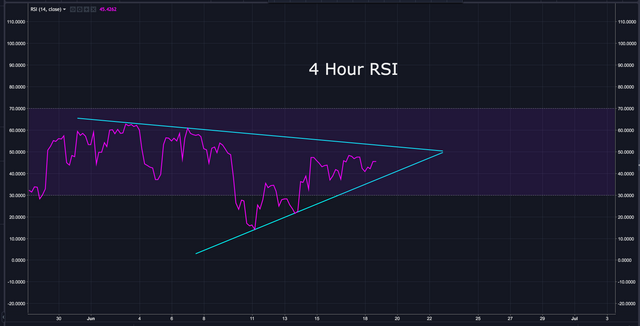
The 4 hour RSI is still operating within the wedge I've pointed out in the past. This tightening pattern suggests a major move may be looming.
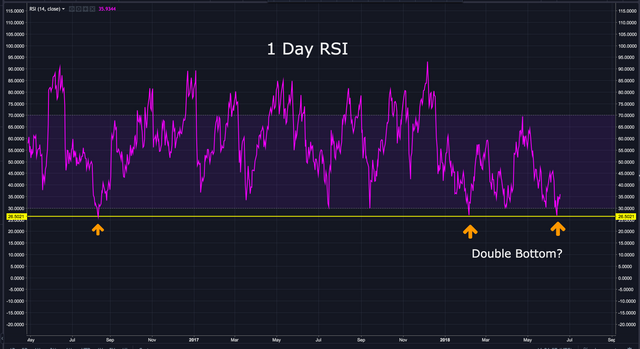
The 1 day RSI reached a low point a few days ago. It's only reached 26.5 two other times since August of 2016. The second was in February of this year, and the third was a few days ago. In the past, that low point was followed by a nice rally. Might that have been a double bottom, forecasting a major rise to come?
Bitcoin can't continue to consolidate like this much longer. I believe a major move is very possible within the next 24-48 hours. Make sure you're watching for bull or bear traps. Often time's bitcoin will briefly break up, or down, only to quickly reverse course and break in the opposite direction. This can trap investors into long or short positions. Wait for a decisive move before entering a position. If you don't want to wait, at least latter in your buying/selling so you're not stuck holding a full bag.
Let's see how the next 24 hour unfold.
BIAS:
Short Term: Slightly Bullish
Longterm: Very Bullish
UPDATE:
Bitcoin broke out right as I posted this update.
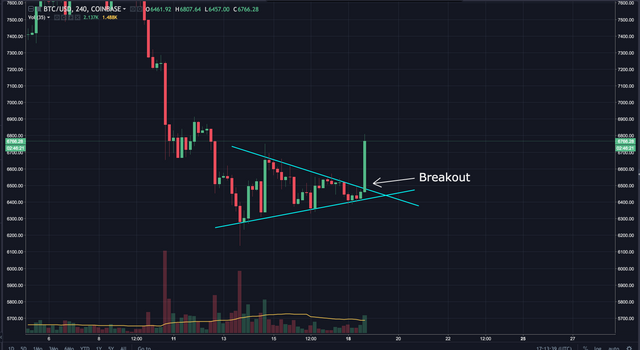
This is a good sign, but as I said, be on the look out for a bull trap. Volume is still weak. We need to see an increase to have any kind of follow through.
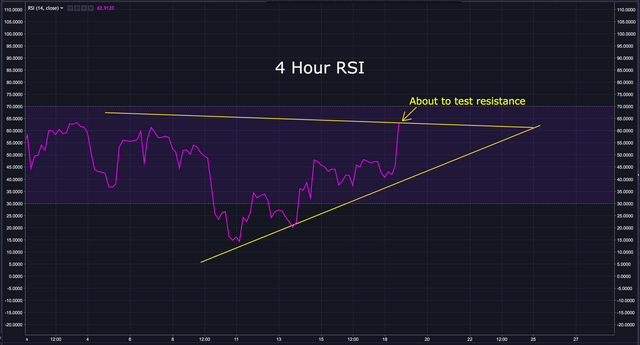
Looking at the 4 hour RSI, it’s about to test the resistance. A decisive break above would be a very bullish indication, and MAY be a good time to start slowly lattering into a position. Of course, that’s just my opinion. Only you can decide what’s right for you.
I hope this has been helpful. I’d be happy to answer any questions in the comment section below. Thanks for stopping by.
If you found this post informative, please:

If you don’t have an account on Binance, I STRONGLY recommend getting one. They’re usually the first to get reputable coins, have excellent security and second to none customer service. You can sign up here free of charge: https://www.binance.com/?ref=16878853

FYI…I just started a Facebook and twitter page where I’ll post analysis, along with other relevant crypto data from myself and others. If you’d like to be notified as soon as updates reach Steemit, the twitter handle is @Workin2005 and the Facebook page is https://www.facebook.com/Workin2005/
Published on

by Workin2005

Good call, looks like we are breaking to the upside now. Decently large 1hr candlestick, moderate volume though.
Thanks. Let’s see if we can get some follow through.
Good analysis and I hope you are right, but it seems we should be in this for the long haul :)
Amazing it happened as you finished posting and your update included! OK, nice work, let's look for the volume to come in, or not, we need some follow through, that's where we've failed many times before. Looking forward to your next charts taking off from here.
Thanks! Great TA ..
My count was on $6900 range to hit target.. Seems like BTC hit 6800 and is consolidating now .. Where do you see the next support & resistance levels?
Thanks
Thanks @sarah0. There's strong resistance between $7,700 and $7,800.
Great analysis!
Could you please do an update on XRP?
Great analysis!
Could you please do an update on XRP?
Thanks. I've updated Ripple here: https://steemit.com/ripple/@workin2005/technical-analysis-on-ripple-approaching-the-apex-on-multiple-indicators
Hope for a positive bull run so that we can wind up our
positions from market
Thanks Dear @workin2005
@maujmasti
Thanks @maujmasti