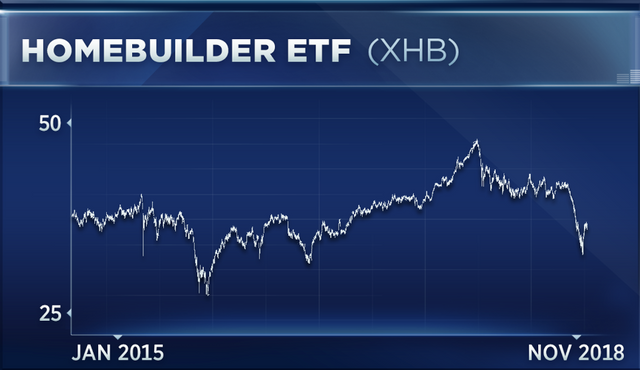
SPDR S&P Homebuilders ETF, XHB Analysis From A Different Perspective

If you aren’t new to my posts, you know I’m bearish on the Housing Market.
The beauty of analyzing Markets is traders can view the same Market differently and get to the the same end destination or conclusion.
Todd Gordon, founder of TradingAnalysis.com thinks the XHB is at cross in the road:
"We are deeply into oversold support here. We have some must hold levels for the XHB," Gordon said Thursday on CNBC's "Trading Nation." "If you look at the entire rally that we've seen since 2016, to do some technicals this is the two-thirds retracement."
A technical retracement refers to a pullback within an uptrend that gives back some of the gains already logged. A two-thirds retracement implies that at least 60 percent of the initial move has been erased. It is often seen as a bullish trend where the charts find support and then resume an upward move.
Gordon said the XHB ETF must hold above the support zone of roughly $31 to $34. If it breaks below this, new lows are highly likely, he said. The ETF also needs to hold its old lows of $25 to $26, added Gordon.
Here are more reasons why I think the XHB is going lower:
Thirty-year fixed mortgage rates, the most common form of borrowing, rose to a seven-year high of 4.94% this week, according to data from the Federal Home Loan Mortgage Corporation.
The Federal National Mortgage Association, or Fannie Mae's, home purchase sentiment index, a closely-watched metric for housing investors, also slipped 2 points this week to a one-year low of 85.7 points.
Philadelphia Housing Sector Index, a measure of the twenty-biggest U.S. homebuilders, has fallen more than 9.2% over the fourth quarter and is down more than 24% for the year.
And this past week, D.R. Horton Inc. the biggest homebuilder in the U.S., fell the most in three years after announcing their quarterly results which were below expectations and said the pace of growth may slow next quarter.
On the monthly chart for D.R. Horton, price is touching the monthly uptrend line.
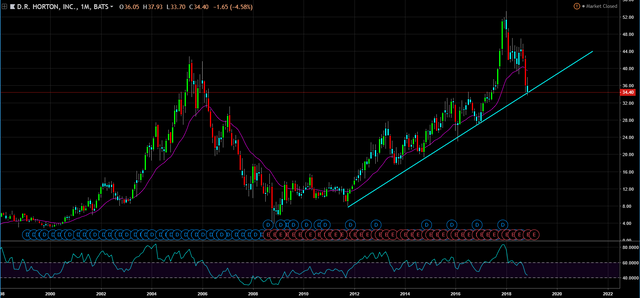
Price is also sitting in monthly demand as well.
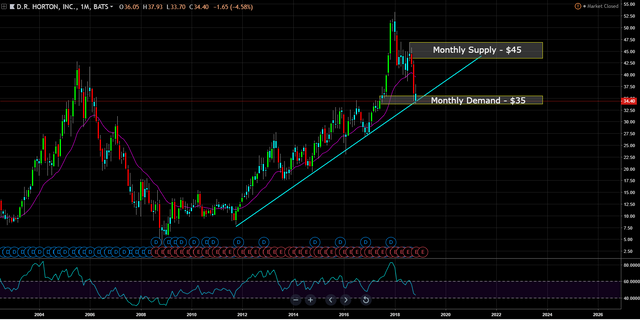
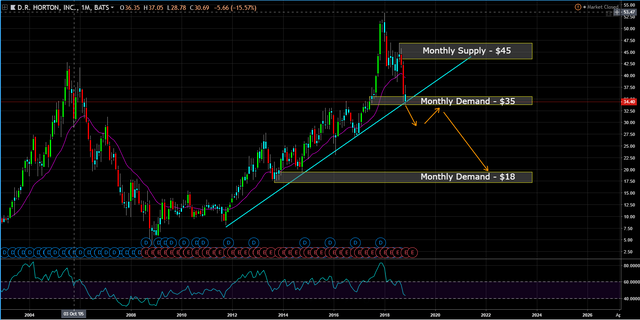
Thus, price is at a critical level. If price breaches the monthly uptrend line and monthly demand zone, the charts suggests price will move down to the next monthly demand at $18.
This post is my personal opinion. I’m not a financial advisor, this isn't financial advise. Do your own research before making investment decisions.

Published on

by rollandthomas

Their margins are also looking week as their inventory of undeveloped land has become more expensive to get as well. I agree that this shoe is about to drop and will be interesting to see what else it brings down with it (like your call on appliances and retailers).
Thanks...just not seeing many buy opportunities out there that I trust.