Spectroscopy Series VOL. 4: Improved surface Raman dispersion SERS
Greetings friends in this opportunity I want to share with all of you the interesting series of spectroscopy that I have been writing for some weeks. Then I present my 4th installment.
If you want to read about the previous deliveries click on the following links:

To begin, I will talk about a spectroscopy technique based on Raman spectroscopy, which is called Improved Surface Raman Dispersion (SERS).
To summarize a bit we can say that Raman spectroscopy is basically having a source of monochromatic illumination which must be irradiated to certain material that we want to analyze. A large part of this irradiated light is elastically dispersed, which is known as Rayleigh scattering. The other portion of scattered light moves as energy from a certain frequency caused by the electromagnetic interactions or vibrations of the molecules within the material, as a result the intensity of the light changes depending on the frequency and thanks to all this we can obtain a spectrum of visible light.
Many know that Raman is a very famous technique, used in different areas of science to identify various materials through these spectra, the versatility of this spectroscopy is due to the many techniques that are known today and from all this we can analyze solid materials, liquid substances, among others. It can be said that the spectrum obtained from each material is the fingerprint of the same or ID identification. The great advantage of Raman spectroscopy, unlike X-rays, is that it is not necessary to destroy the sample in order to perform its subsequent analysis, it is performed directly on the material without the need of any specific treatment.
The SERS technique
The physical principle of this technique is based on the following: certain spectral phenomenon obtained through what was explained above, that is to say the Raman dispersion principle, a monochromatic light source is used that produces the desired dispersion, before analyzing the sample this light dispersed, the most intense signal is filtered due to Rayleigh scattering in order to prevent the signals from becoming saturated and producing spectral errors. This means that the technique can transform these weak signals into much stronger signals that can be detected in a simple way and thus obtain a characteristic spectrum of a certain material.
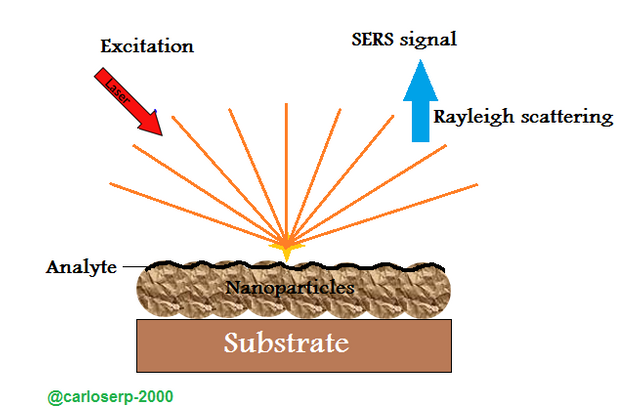
All this phenomenon involved in this technique of transforming weak signals into powerful signals is known as the plasmon, particularly this is created on the surface of the sample generated by light that achieves a high dispersion on its surface.
The technique uses a mixture generally made up of two phases (liquid and solid) that are dispersed throughout the material. The Raman dispersion of these molecules allows it to be absorbed into the surface of the material successfully. SERS performs a complete sweep of the material analyzing the lowest concentrations of vibrations and spectra of the material, which brings with it spectra that allow the detection of very small portions of various substances.
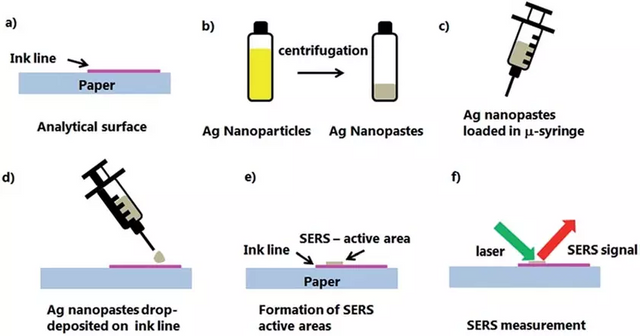
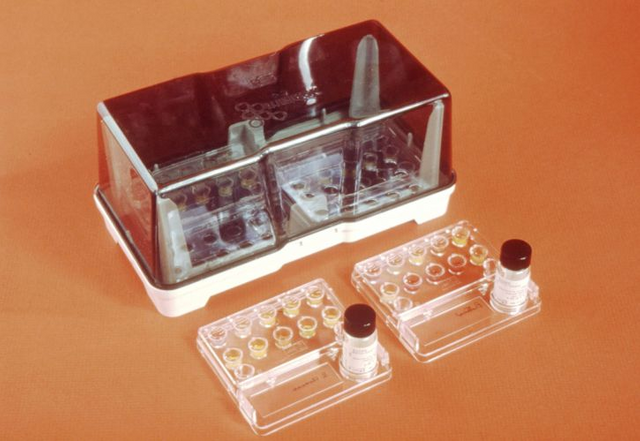
Scheme of sample preparation for SERS measurementsLicensed CC BY 4.0
It should be noted that SERS to be able to observe this phenomenon and be able to function correctly uses two essential mechanisms, these depend on the molecular nature of the material and of course on the experimental conditions in which it is surrounded. These mechanisms are caused by the electromagnetic interaction of the molecule and substrate and are the following:
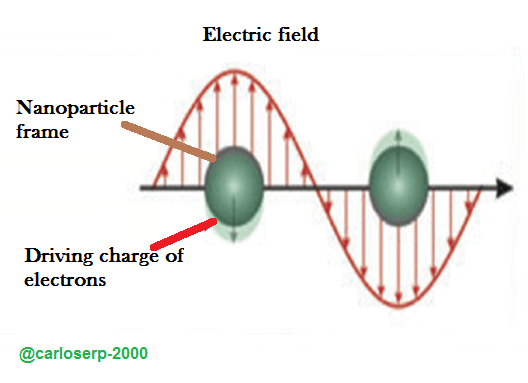
The electromagnetic mechanisms, to understand this phenomenon imagine that we hit a photon on the surface of the material where it is the plasmon, this tends to polarize from a very small particle by means of the resonance that occurs on the surface of the material, which makes the spectrum can be intensified at a longer wavelength.
The result of this intensity of the signal emitted from the dispersion phenomenon is due to the fact that the molecule of the material does not only affect the electromagnetic radiation of the emitted light, it can be said that its consequences also slightly affect the surface of the material.
Another important point is that the intensity not only depends on the magnetic field that falls on (I α E2), also the signal emitted from the obtained Raman dispersion is greater than the signal that the spectrum presents, all this produces a considerable increase of photons that they can affect the analyzed material, that is, if we have a large number of photons there is a probability that the dispersion phenomenon increases just as the absorption must increase the effective section of the material.
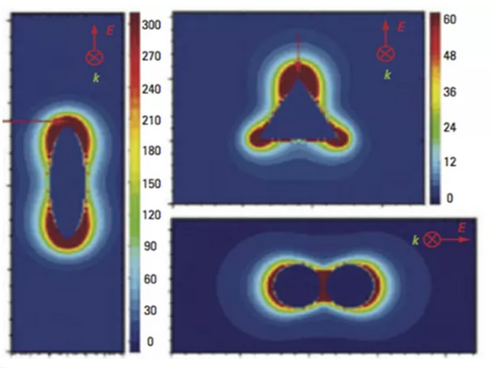
Then in the following image we can clearly see how the electromagnetic field increases made up of elements of different nature, this refers to its location and concentration depends on the geometry of the particles present in the material. Generally this phenomenon can be visualized in spherical particles and is called _ hot spots_ otherwise, they would be located in areas of maximum curvature on nano-rough surfaces.
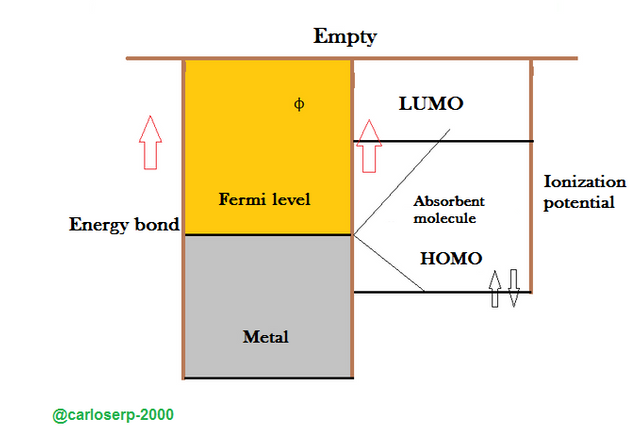
The following mechanism is the Chemical or load transfer, this is that when the molecule hits the surface of the material occurs a very particular phenomenon called "Chemisorption", produced by the polarization of electromagnetic light emission on the surface of the substrate that results in the formation of an asymmetry different from the initial one, which helps to obtain a better load transfer between the metal and the orbitals of the formed material. Then it must be left at rest for a certain time so that the electronically excited state can then emit a low frequency, thus giving a considerable difference between the emission and incidence of the frequency of the arrival level and forming the resonance process.
The substrates play an important role for the analysis of SERS since on the surfaces of the samples the so-called "active plates" are presented, this particle generates the intensification of the electromagnetic field. substrates in SERS measurements provide us with a very effective measure to obtain a fully visible spectrum, they are very reliable, stable and extremely sensitive to the emission of light. These substrates generate a total amplification of the signal which allows to clearly observe the characteristic spectra of each material
The result is fast and reproducible SERS measurements to identify and quantify analytes, with detections at ppb level and even ppt. The standard substrates have the format of microscope slides, with an active surface of 5 mm in diameter. Ocean Optics uses borosilicate optical glass and a high performance silicone adhesive to offer compatibility with a wide range of solvents.
Some substrates that have their respective application are such as; the nanosponge used to detect explosives and different types of narcotics. Others also for the quality control of different foods by means of gold nanoparticles. Chemical and biological agents, plasmonic substrates of low cost and high reproducibility for the detection of analytes in both liquid and solid. All this is important since the SERS technique allows to increase the weak signals in orders of considerable enough magnitude.
Some of the substrates most used today are such as Electrodes whose surface is rough by the application of several oxidation-reduction cycles, metallic islet films, metal colloids and lithographed nanostructures on a surface.
Raman surface dispersion spectra improved
A very common feature of the spectra obtained through this technique is that considerable changes occur in the surface of the metal in the sample molecule and its environment bring with it the presence of different modifications in its spectral profile, these changes can be such as: absolute intensity, relative intensity of the bands, width of bands and appearance of new bands in its spectrum.
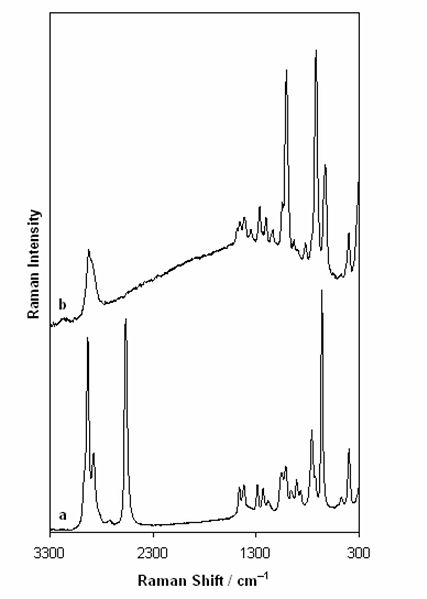
Raman spectrum characteristic of liquid mercaptoethanol and SERS spectrum of 2-mercaptoethanol monolayer formed in rough silver Licensed CC BY-SA 2.5 of Paszczakowna1
We can also observe spectra obtained from different materials, more than any chemical, this technique may differ slightly from the characteristic Raman spectra, since the mechanism of signal intensification is mainly related to CT.
According to the aforementioned the bands of the spectrum can change, their relative intensity also, this happens because of the resonance of the plasmon on the surface of the material. The chemical changes produced in the material that tend to move at different wavelengths produces a widening of the bands in the molecule produced by the appearance of molecular states and new spectral lines.
The other major difference, logically, is that the intensity of the Raman lines is greater than that found in conventional Raman spectra.
In conclusion, the analysis by means of the SERS technique can provide extremely important information about the molecular structure and orientation of the material surface.
On the other hand, the mechanism of interaction and the orientation of the molecule on the surface can change if the conditions of the medium change, that is, if factors such as the concentration of the adsorbate or the pH are modified. The use of different surfaces also induces different changes on the SERS spectra due to the physical-chemical variables of the nanostructures (different plasmons) and the interfaces (nature of the metal and the presence of other species on the surface).
If you want more information about the subject you can visit the following links:
Surface-enhanced Raman spectroscopy
SERS: Materials, applications, and the future
What is surface enhanced Raman scattering, or SERS?
Surface-Enhanced Raman Scattering: A Technique of Choice for Molecular Detection
Surface Plasmon Resonance: An Introduction to a Surface Spectroscopy Technique

Video credits @gtg
Congratulations! Your post has been selected as a daily Steemit truffle! It is listed on rank 5 of all contributions awarded today. You can find the TOP DAILY TRUFFLE PICKS HERE.
I upvoted your contribution because to my mind your post is at least 8 SBD worth and should receive 207 votes. It's now up to the lovely Steemit community to make this come true.
I am
TrufflePig, an Artificial Intelligence Bot that helps minnows and content curators using Machine Learning. If you are curious how I select content, you can find an explanation here!Have a nice day and sincerely yours,

TrufflePigThis post has been voted on by the SteemSTEM curation team and voting trail in collaboration with @utopian-io.
If you appreciate the work we are doing then consider voting both projects for witness by selecting stem.witness and utopian-io!
For additional information please join us on the SteemSTEM discord and to get to know the rest of the community!
Hi @carloserp-2000!
Your post was upvoted by Utopian.io in cooperation with @steemstem - supporting knowledge, innovation and technological advancement on the Steem Blockchain.
Contribute to Open Source with utopian.io
Learn how to contribute on our website and join the new open source economy.
Want to chat? Join the Utopian Community on Discord https://discord.gg/h52nFrV
This is really a long and educative post for learning SERS technique. Thank you for sharing.
So my question is: Is there any spot-size limitation for the analysis? For instance, I have a 6 inch of the substrate and I would like to extract the whole surface spectra. Is it possible such a thing like this? Can we make a sort of sweep of the laser source?