Spectroscopy Series VOL. 3: Calibration of a Spectrometer and Applications
Greetings steemians before starting can visit my two previous deliveries on spectroscopy so they can be aware of the thematic sequence

After having given a little hint about Raman spectroscopy, explaining this phenomenon theoretically and detailing the operation of each component within a spectrometer, no less important is what I will explain below.
A very important detail that we must apply before making any measurement with the spectrometer is the calibration of the equipment, we know perfectly that when certain measurement equipment does not present a good calibration, the incorrect results are evident, to avoid this inconvenience it is good to have knowledge basic how to calibrate the spectrometer, perhaps many of you are familiar with this procedure or maybe not others, actually students and professionals in pure sciences have an idea of this procedure, although I would like to refresh a bit.
I do not want this post to become somewhat complicated or boringly extensive explaining complex methods of calibration that leave readers in the news such as interpolation or linear extrapolation or the adjustment by least squares, this time we will go down the road more simple.
One of the frequent errors by us when calibrating a spectrometer is caused by the wrong movement of the monochromator, since moving it in-adequately becomes the axis of the abscissa, which is the wavelength. The incorrect mobilization produces a horizontal displacement to the measured spectrum, which results in errors when identifying colors of the measured spectra, since their correct position is that of the bands with respect to the origin.
A very simple technique to avoid this type of inconvenience is to use known Raman spectra and they are taken as a comparison pattern, for example diamond, mercury or ultramarine blue, whose fundamental bands are known and easy to locate.
It should be taken into account that in the spectroscopy there are different experimental techniques, that is, different equipment with different configurations, this calibration example is the universal and basic in the spectroscopy, since in different techniques different calibration methods are used. Although we basically use this method for approximately 80% of measurements.
Example of calibration
Next in the following figure we can observe two experimental spectra obtained from a red and a green laser, these contain Raman bands that we could later take as an example of calibration comparing each spectrum.
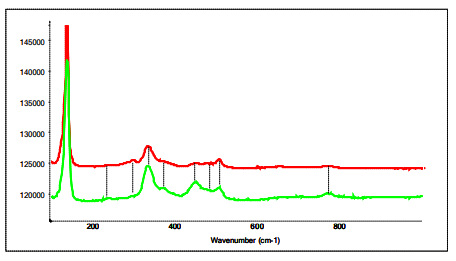
Spectra of red and green laser from ternary yellow.
Although the calibration method most used by most scientists working with this type of spectroscopic technique, is the use of the Rayleigh component, this is to center this characteristic peak on the origin of the normal wave number cone shown in the next figure.
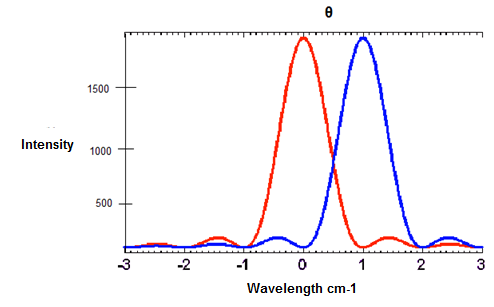
Spectrum calibration through the Rayleigh band.
Spectroscopy has several advantages, that is why it is one of the most used techniques for the characterization of materials in different areas of science and in turn has a wide variety of applications in the global industry.
One of its great advantages is that it is not necessary any specific treatment for the preparation of the samples that are going to be characterized, since its simplicity allows to inspect with other comparative techniques. By this I mean that spectroscopy is based on a non-destructive technique.
There are techniques that can analyze the chemical composition of different compounds, either organic or inorganic, and the best part of all this is that there is no need to destroy the samples to make measurements with this technique as others, that gives you the opportunity to use the samples for other specific techniques. In the same way, solid, liquid and gaseous compounds can be analyzed. Later in the course of the days I will explain a variety of techniques with this series of post on spectroscopy.
Other techniques such as X-ray diffraction only allow you to determine the crystalline chemical composition, while Raman offers to characterize any type of material regardless of its state.
In the same way you can study amorphous compounds, organic and ordered solids.
You do not need a vacuum chamber that is expensive and that requires difficult and annoying care, regardless of whether you are exposed to the environment in the same way that you can characterize the spectra, as long as you take the necessary calibration measurements when measuring.
Some Raman-based spectroscopy techniques are such as:
- Improved Surface Raman Dispersion (SERS).
- Raman resonance.
- Raman spectroscopy coupled to confocal microscopy.
- FTIR spectroscopy.
- Ultraviolet-Visible Spectroscopy.
- X-ray photoelectron spectroscopy (XPS).
- Atomic absorption spectroscopy.
- Nuclear magnetic resonance spectroscopy.
- Fluorescence spectroscopy.
- Mass spectroscopy.
These techniques are widely used today some are based on Raman principles and the latter are more specific, it should be noted that many techniques of spectroscopy are coupled with other techniques of characterization of materials. But basically what it is about analyzing and explaining is a spectrum of a material.
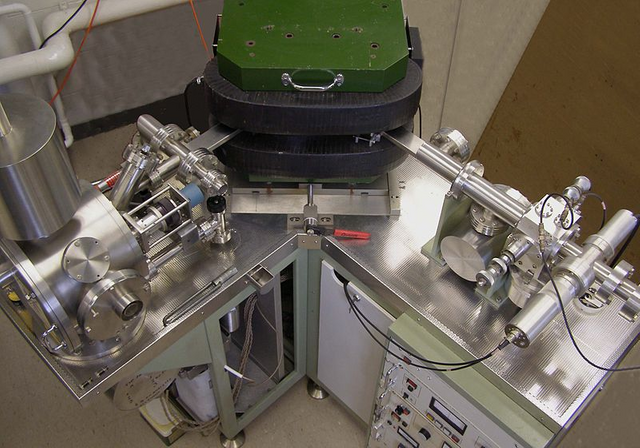
Thermal ionization mass spectrometer Licensed CC0 1.0
Some applications of spectroscopy
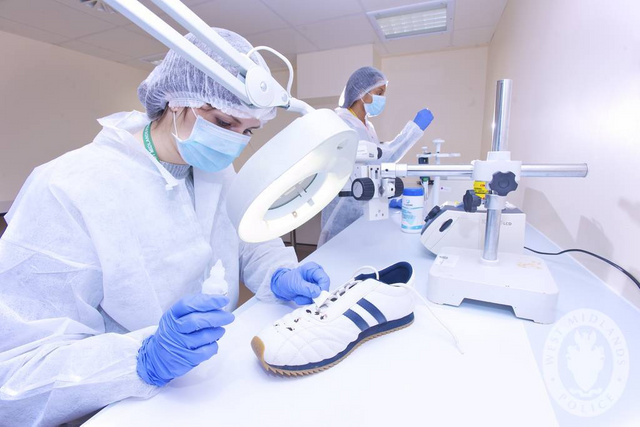
Spectroscopy in medicine is a very important tool specifically in forensic medicine since it is extremely powerful for the analysis of different samples and the great advantage that can be very small without the need to destroy them.
Some other applications in this area are: drug abuse, identification of explosives and chemical substances found in clandestine laboratories that include: inks, hair, paints, among others.
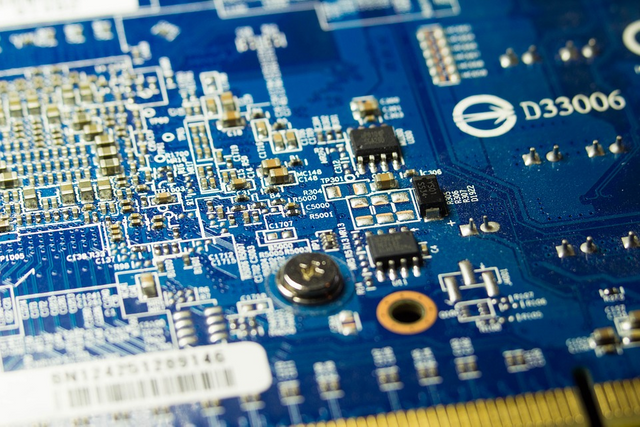
In Semiconductors it is quite used, perhaps one of the areas where it has the greatest application, in particular for the manufacture of synthetic diamond, since it is the only technique that can identify this type of semiconductor compound, it allows to determine the contamination in the contacts of the sample, used in turn in various components of accessory electricity circuits.
In the Pharmaceutical industry for the crystallization of different compounds used for the manufacture of medicines. Monitoring of new medicines. Real-time analysis of chemical reactions. Identification of polyform form.

In Biomedical, it allows to identify different types of cancer diseases: cervix, skin, breast, oral). Through studies of chemical concentration we can obtain this type of results. Also in studies in the eye (cornea and fluids), atherosclerosis inter-cornary. In some studies of bone marrow, determining by means of spectra its composition, mechanics and its state. Similarly in the verification of transdermal drug studies.
In the Automotive industry and petroleum derivatives, solvent extraction, aggregation. BTEX production materials. Processing of aromatics. Hydrocarbons. Gasoline. And many types of polymers.
Nowadays, spectroscopy is widely used to identify, examine some specific compounds that we do not have on our planet. For example on Mars is a powerful tool for this type of studies and in the future with progress. of Technology can become the main tool to determine if life exists or not on another planet.
Art and archeology allow the identification of real and false objects.

In the same way in gemology, verify the authentic materials and their origin.
Geology, identification of different minerals.
Determination of different compounds in the environment.
For the alimentary sciences, to be able to corroborate the content of each food.
And many other applications that I will show you as you share the different spectroscopy techniques with you in more detail.
Undoubtedly, the subject of spectroscopy is quite interesting, do not forget to read my next contributions where I will deepen about each technique of spectroscopy.
See you until a next installment!
SourceS of cover images:
1
2
3
If you want more information about the subject you can visit the following links:

Video credits @gtg
This post has been voted on by the SteemSTEM curation team and voting trail in collaboration with @utopian-io.
If you appreciate the work we are doing then consider voting both projects for witness by selecting stem.witness and utopian-io!
For additional information please join us on the SteemSTEM discord and to get to know the rest of the community!
Hi @carloserp-2000!
Your post was upvoted by Utopian.io in cooperation with @steemstem - supporting knowledge, innovation and technological advancement on the Steem Blockchain.
Contribute to Open Source with utopian.io
Learn how to contribute on our website and join the new open source economy.
Want to chat? Join the Utopian Community on Discord https://discord.gg/h52nFrV