Bitcoin Price Forecast & Analysis
It's been a while since I've last did an analysis, but I thought given where Bitcoin is positioned - it's due for a closer look once more. We have some conflicting cues on the Weekly chart, and overall sentiment in my opinion is bullish - however I don't think this is a good entry for swing traders to go long or short... not yet, but soon.
First, let's look at the immediate Resistant factors:
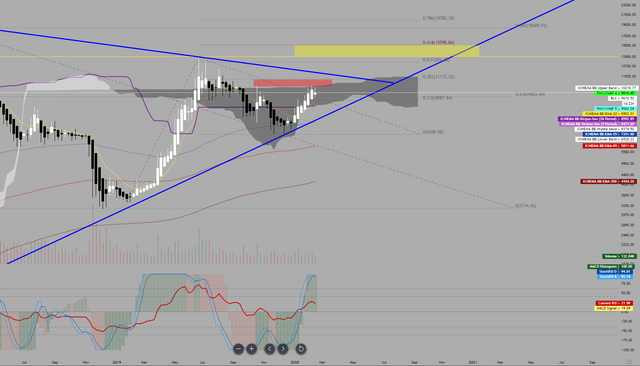
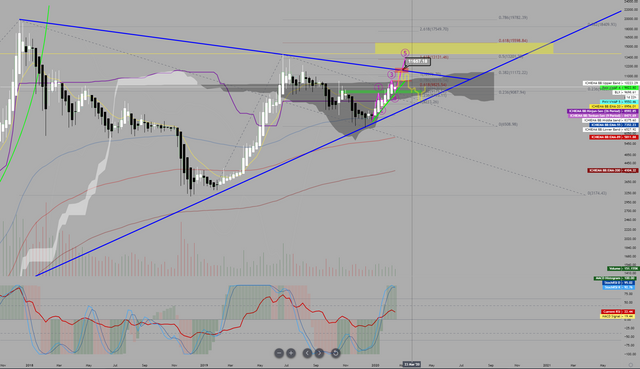
- Edge to Edge move within the Kumo has been completed, we hit 105xx at the cloud resistance and pulled back to where it is now at 96xx.
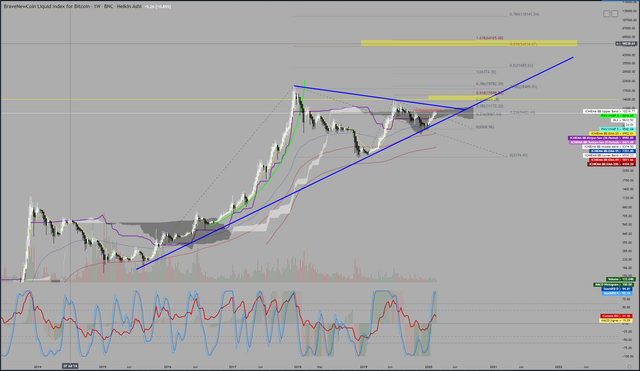
- Top of weekly kumo is strengthened by previous rejection back in October 2019, quite a significant price level even in the months prior to October where price action closed 5 times at this level - We have to respect this topline of the kumo.
- Stochastic RSI is sitting above 90, and K has crossed below D, RSI reflects this with a minor direction change.
- Volume for this week is about 30% less than previous week, typically to break through key S/R levels you want to see volume significantly increasing.
If, momentum somehow breaks above 105xx, there is likely to be strong resistance from the trend-line connecting the all time high and 14xxx at its point of contact. Estimation puts that at 119xx or lower depending on time. If we fail to break 105xx then likely scenario is price will move back to the Kinjun at 86xx to try garnish further bullish momentum
Summery of Bearish Outcome:
-If 10500 fails to break, look for price to move to towards 86xx
-If 86xx support fails, 65xx and 30xx are the next significant levels under.
Lets have a look at the Bullish factors:
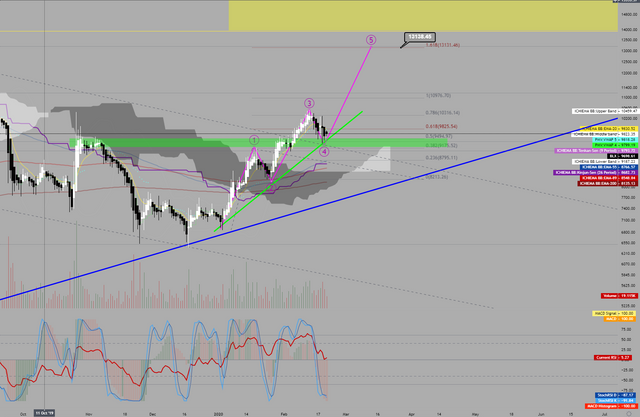
Looking at the Daily Chart we can see several cues for bullish bias that may yet produce the momentum needed to break the 105xx and kumo on the weekly.
- Trendline support on both the 2nd and 4th correction waves, setting us up for an extended 1.618 5th wave of the Elliot Wave pattern.
- Criteria for Elliot Wave pattern is so far met, with 4th wave also in an alternated support area of previous resistance from peak of Wave 1, and also resistance back in November 2019 distribution.
- Stochastic RSI is sitting below 85/90, although K has yet to cross back above the D.
- RSI has slightly kinked up on the midline suggesting a possible swing back up.
- Last 3 days consecutively has produced lesser supply volume, suggesting mild exhaustion.
- Kumo Cloud has made a bullish cross not seen since April 2019 at the early stages of the last bull run.
- On both Weekly and Daily we are trading above the Kinjun that rests at 86xx and 85xx
As I stated in the intro, this is the conflicting cues present that we see contrasting the Weekly and Daily chart. While it's clear that on the Daily there are significantly more bullish cues than bearish cues on the Weekly, this somewhat balances out as you tend to give more strength to cues on wider timeframes.
My overall conclusion and what I speculate will occur:
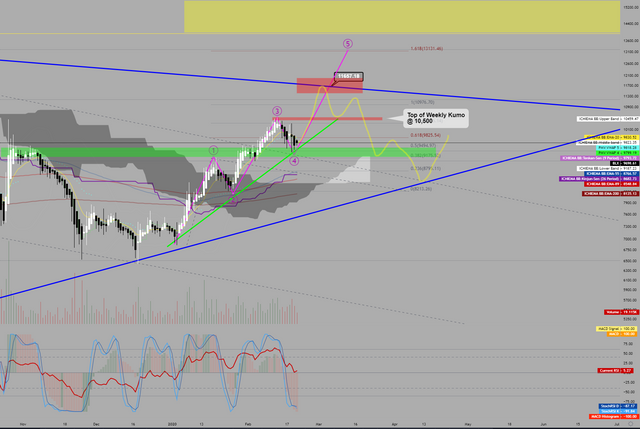
- Volume will increase in the shorter term and respect the 5-Wave Elliot pattern, pushing price to break 105xx
- Breaking 105xx will trigger momentum as it breaks the kumo cloud on the weekly.
- However price stalls at 117xx instead of completing the full 1.618 extension to 132xx - due to trendline resistance from All time high and previous high at 14xxx
- This move will likely trap many bulls in the 105xx - 117xx area, while Daily and Weekly Stochastics align at 90+
- Consolidation down to 85xx/86xx to retest the Weekly Kinjun
- Price Squeezes to tip of the major wedge formation (as illustrated on weekly chart) before major breakout or breakdown.
Thanks for Reading, I hope you found this information and Analysis valuable. As a quick disclaimer, I am not a Financial Adviser and this information is not to be considered as instructional advice.
Very nice analysis, you should post more.
Posted via Steemleo
Thanks, will do :) Although personally I find the intraday stuff a little harder to pick out.
Congratulations @mickbit! You have completed the following achievement on the Steem blockchain and have been rewarded with new badge(s) :
You can view your badges on your Steem Board and compare to others on the Steem Ranking
If you no longer want to receive notifications, reply to this comment with the word
STOPVote for @Steemitboard as a witness to get one more award and increased upvotes!