Crypto Academy Season 4 [ Advanced course ] week 2: Crypto Trading With Volume Indicator by @whitestallion

Hello friends and welcome to my assignment task by professor @kouba01, in this assignment I will talk about Crypto Trading With the aid of Volume Indicator, I hope you enjoy and learn from my assignment.

Question (1)
Explain the volume indicator in your own words
A volume Indicator is a trading and investment tool that is used to determine the amount or number of assets or security that were traded within a specified period. The data that is displayed is gotten from the cumulative transaction that has occurred within a particular exchange platform.
The Volume indicator is displayed below the price chart in a trading or chatting platform, it is represented with rectangular bars that are very close to each other but differ in height due to the amount of Selling or Buying volume that occurred within a specific period, this will determine if the rectangular bars could either be tall or short.
The Volume indicator Bars are mostly identified with 2 colors which are Green and Red. The Green signifies that there has been a lot of buyers in the market while the Red signifies that there has been a lot of sellers in the market, while the height of the rectangular Bars signifies the strength of the buyers or sellers.
The volume indicator is not advisable to be used as a standalone indicator, rather it is ideal to be merged with other indicators eg. RSI (Relative Strength Index) or the MA( Moving Average).
Question (2)
Use a platform other than Tradingview to present the volume indicator on a chart and show how to configure its parameters by justifying your choices. (Screenshot required)
Below are Steps to add and configure the Volume Indicator
Step 1. Access a trading platform in this case I will be using the Binance Trading Interface.
Step 2. Log in/ create an account, click on the Trade Tab. This will give you Options on different Trading Interfaces used on the Binance exchange. Click on any according to your expertise, in this case, I will be using the Advanced Trading Interface.

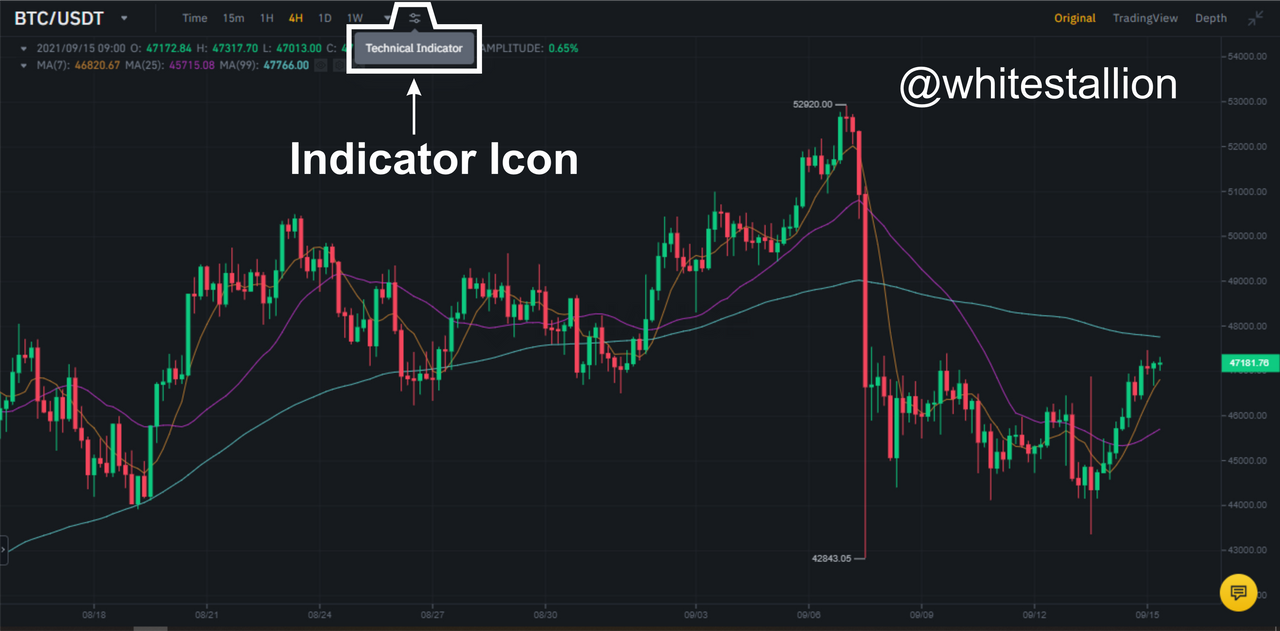
Step 3. Click on the Expansion Icon to expand the Trading chart display.

Binance Trading Interface
The Trading interface comes with already added indicators which include the MA( Moving Average) and the Volume Indicators. But in this case, I will show how to add it in case it is not available on the interface display.
Step 4. Click on the indicator icon, which will bring out an infoBox that contains a list of different indicators on the Binance Trading Interface.
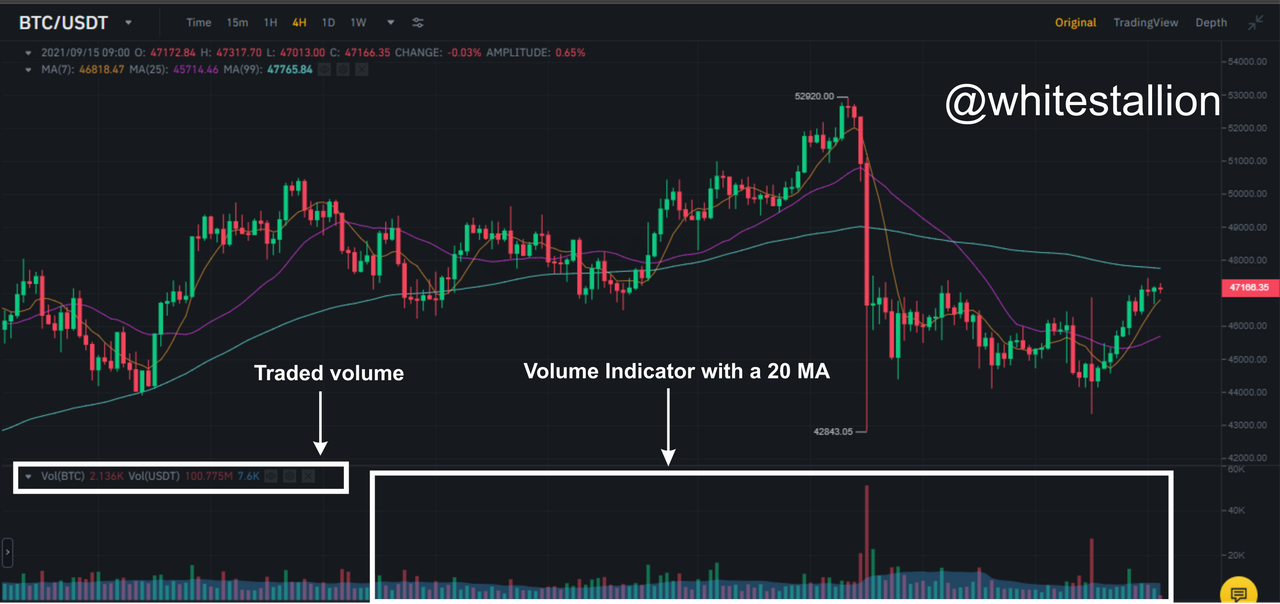
Step 5. Search or scroll down to see the Volume check Box

Step 6. Click on the Volume Indicator check box. This will bring out the volume configuration section where you can configure the Volume indicator by adding the MA( Moving Average) Period, this addition of the 20MA will help the trader have a clear perspective of the market trend in respect to the Volume indicator. Also, the color setting or palette which is used to distinguish the difference in color between the MA and the Volume Indicator is available.

Step 7. Click on save to make your changes come to effect.
Question (3)
What is the link between Volume and Trend and How to use volume to predict a trend reversal? (Screenshot required)
- The link between Volume and Trend
The Volume indicator measures the amount or number of an asset or security that has traded within a specified period on an exchange. This means that investors or Traders can make use of the VOlume indicator to determine the trend of the market because the volume indicator helps them identify how weak or strong a trend is going to be, thereby helping them avoid the risky volatile markets.
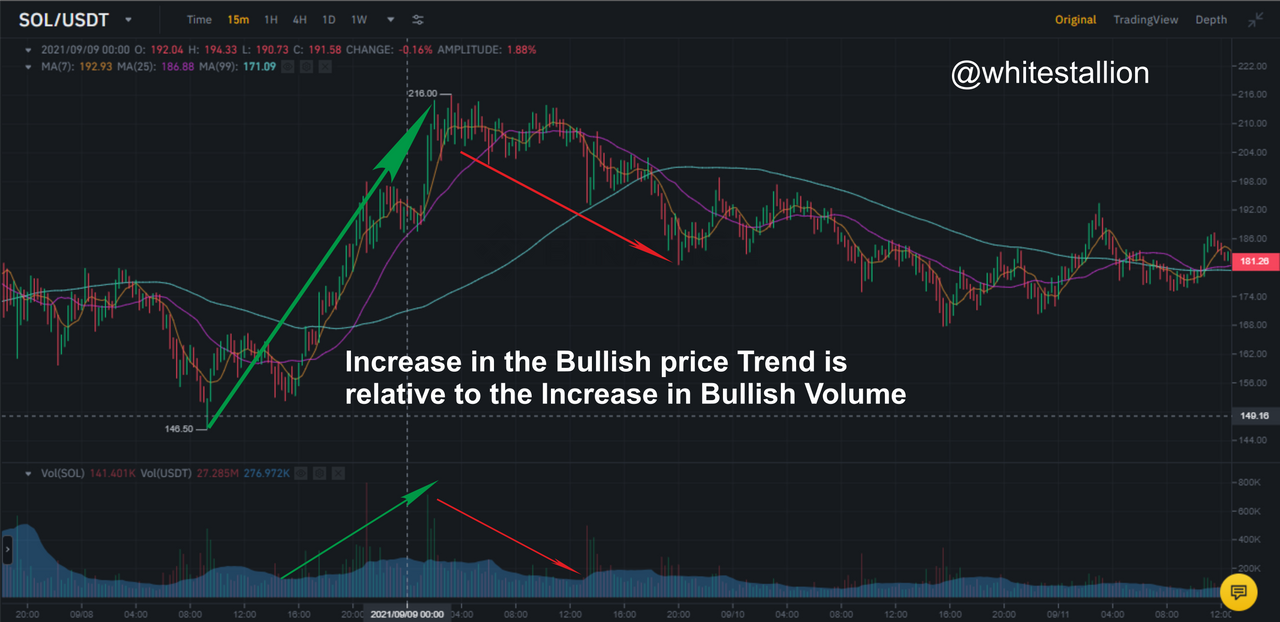
The diagram below shows the link between the Volume indicator and Trends. In a Bullish Market, The price increase is relative to the increase in Volume(upward trend), also a price decrease is relative to a decrease in Volume(downward trend).
In a Bearish Market, a decrease in price movement is relative to an increased volume( Upward movement), While a decrease in Volume is divergent to the increase in price movement.

- How to use volume to predict a trend reversal
A trend reversal is a change in the direction of price movement which can be an up or down Trend. The volume indicator can be used to determine when there could be a reversal in the Price Trend. This could be identified when there is a decrease in Volume in a Bullish Market, this means that the buyers in the market are getting weak and sellers will soon dominate the market.

Binance Trading interface.
Above is the SOL/USDT chart that shows a short reversal in trend from bullish to a bearish trend. From the image above, the increase of the Volume bars began to reduce, this signalled a bearish trend because buyers in the market were decreasing. Looking at the chart you can see that after that decrease in volume there was a short bearish trend that followed.
Question (4)
How to use the volume to have a signal confirmation? (Screenshot required)
- Price/ Trend Momentum
Identification of Price/Trend momentum is ideal for investors or traders who are engaged with an ongoing Trade because it helps them know how weak or strong a trend is. it also helps them identify entry or exit points in a bearish or bullish market.

- Identification of a Breakout
A breakout is identified after the price either goes over or below the Resistance or support line due to Selling or Buying pressure from traders.

From the image above the Solona coin had a break out towards a bullish trend after crossing the resistance level, this could be confirmed using the Volume indicator which also had a corresponding increase during that period.
Question (5)
How does the volume reflect the evolution of prices in the charts and why does the volume sometimes anticipate the price? (Screenshot required)
- How does the volume reflect the evolution of prices
Volume indicator reflects the activities of buyers and sellers in the exchange market by representing a collective sum of the number of assets traded within a specified period. During a Bullish or Bearish trend, the volume indicator gradually builds momentum toward an upward or downward movement based on the amount of buying and selling taking place in the exchange market. This means that the more Buyers or Sellers are strongly entering the market the Volume indicator gradually Builds momentum towards an upward direction, while the weaker the Buyers or Sellers start to get the Volume indicator will lose momentum towards a downward movement.

From the Image above, the SOL/USDT moved made a strong uptrend or Bullish movement, this was supported by an upward movement of the Volume indicator due to the influx of buyers into the market.

This also applies in a Bearish market where the movement of the Volume indicator gears an upward momentum due to the influx of Sellers in the Market.
- Why does the volume sometimes anticipate the price?
The reason why the Volume indicator sometimes anticipates price is because of its ability to track the momentum of the trading activities by Buyers and Sellers in the exchange market. The selling and Buying pressure drive the momentum that is why in a Bearish trend the Volume indicator will display a decrease in selling pressure, this will later play out as a reversal in trend when a bullish trend is initiated.
This is similar to a Bullish trend where the Volume indicator will display a decrease in Buying pressure while the market is still bullish, this will later pan out to initiate a Bearish trend due to a decrease in Buyers.
Question (6)
Is it better to use the volume indicator alone or use it in parallel with another indicator when trading? Justify your answer
It is ideal to use an additional Technical Indicator with the Volume Indicator when Predicting or analyzing the market to maximize a successful outcome, this should include the RSI or MACD ADX.
The Volume indicator provides data on the number of trading assets that have been executed in the market within a specified period. The volume indicator cannot be used to carry out other Technical analyses due to some areas of limitations.
An example is the ICO( Initial coin Offering ) This is a fundraising process for a crypto project. This is done by advertising and inviting investors to take part in crowd sale events of their coin. These transactions do not tend to occur on exchange platforms but a reader on the startup websites. When these startups later launch on exchanges, there will be limited data on the already traded Volume of the Crypto asset or Security, thereby making it a very risky form of investment.
Question (7)
The volume indicators are multiple, choose one of them to briefly explain its usefulness in crypto trading.
- On-Balance-Volume (OBV)
The OBV or the On-Balance-Volume is a volume and momentum-based Trading indicator that Uses volume to predict change in price movement. It was first developed by Joseph Granville in 1963 through a book called Granville's New Key to Stock Market Profits.

Binance Trading interface.
The OBV Comares correlative actions between the Volume indicator bars and uses it to provide a more sufficient signal. The OBV is used by investors to detect sudden changes in price movement. It also helps them detect when large sophisticated investors are coming into the market or if it is just retail investors or scalping traders.
The OBV is a leading indicator which means it will try to predict the price movement, but it sometimes says very little about the previous price actions. It is therefore ideal to merge the OBV with Other indicators to achieve better outcomes.
Conclusion
The Volume Indicator is a trading and investment tool that is used to predict the momentum and volume that an asset or security ( e.g Cryptocurrency) has traded for a specified period. The Volume indicator can be used by investors the predicted change in price movement and also help them know how strong or weak a Bullish or Bearish trend is.
It is of the essence to note that the volume indicator can sometimes produce false signals that is why it is good to merge them with other indicators so that the trader can receive better satisfying outcomes.
Thank you professor @kouba01 for this amazing lecture.
Hi @whitestallion
Thanks for participating in the Steemit Crypto Academy
Feedback
This is good content. Thanks for expressing your understanding of Trading using the Volume indicator.
Total| 9/10
Thanks so much @yohan2on for your honest feedback
Bro you are doing well