Crypto Academy | Season 4 | Week 1 - Homework Post for @allbert | Trading with Strong, Weak and Gap Levels
Hello Everyone,
Welcome to the 04th season of Crypto Academy. I'm excited to begin the first homework for the season. To start crypto prof. @allbert has shared his knowledge about Trading with Strong, Weak and Gap Levels. Trading topics are my favorites. Let's move on to the homework.

Graphically, explain the difference between Weak and Strong Levels. Explain what happens in the market for these differences to occur

- Concept of Support and Resistance,
We know that the cryptocurrency market is highly volatile. Demand and supply of the market constantly change the price and we track these price movements on a trading chart comparative to a price pair. When the price has directional movements we analyze them as downwards, upwards or ranging market.
In such price movement, there are certain significant levels where price might hold / stop and rebound. Sometimes these levels are clearly visible as a horizontal line and sometimes they are not so precise lines. In such cases, these levels can act as a zone of resistance or support.
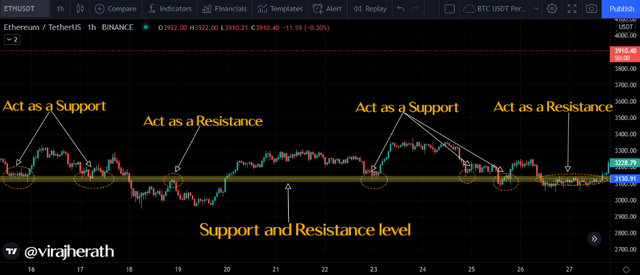
ETH/USDT | 1h | tradingview.com
Support and Resistance Levels
In above figure, you can see the instance where the price pull back to the marked level (horizontal line) and bouncing off from the same. When the line is underneath the price swing points, we consider that level as a potential Support level, conversely when the line is above the price swing points, we consider that level as a potential Resistance level.
Note that the same line can act as both support and resistance. This is only happening because of the market demand and supply. We can consider such levels as popular price zones. When the price declines to the lower prices, that will attract willing buyers and provide more liquidity to the market. Conversely, when the price gets high more selling orders will be filled and the price can be pulled back to where it was previously.
Hence the support and resistance can be simply identified as the areas of a barrier to the directions of the advancing trends.
- Difference between Weak and Strong Levels,
Now that we have a clear understanding of the Support and Resistance levels we should understand that these levels have Weak and Strong levels. Nobody can guarantee or expect that these levels cannot penetrate beyond or price to be held at the same level forever.
Instead, we can see that sometimes the price touching some levels multiple times but cannot penetrate beyond while some levels easily penetrated. As previously described, this too has a theatrical explanation with market demand and supply. Because price action purely happens due to the fact of buyers and sellers negotiating for prices in a competitive environment. Market will always respond to the buying and selling pressure.
When there is a Strong Level we consider that market has a potentially large amount of buy or sell orders in large volumes at this particular level. Due to the high volume penetrating such levels are not easy and take time. Only when a large amount of extra liquidity injects into the market these levels will be penetrated with adverse price moves.
Similarly, when there is a Weak Level we consider that market has a potentially smaller amount of buy or sell orders in low volumes at this particular level. Because it has low volume, the market can be manipulated easily with extra supply.
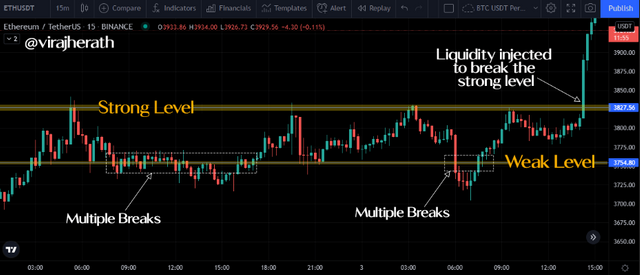
ETH/USDT | 15m | tradingview.com
Weak & Strong Levels
Hence, the strength of the Support and Resistance Levels will always depend on the amount of buy and sell orders and the volume in the market. Here we have to note that Support levels are influenced by pending buy orders and the Resistance levels are influenced by pending sell orders.
Explain what a Gap is. What happens in the market to cause It.
- What is GAP?
A gap on a chart can be seen when there's space between the price of previous candle and the open of the consequent candle. This can happen two ways,
Gap down: This can occur when the candle close price is lower than the consequent candle opening.
Gap up: This can occur when candle the close price is greater than the consequent candle opening.
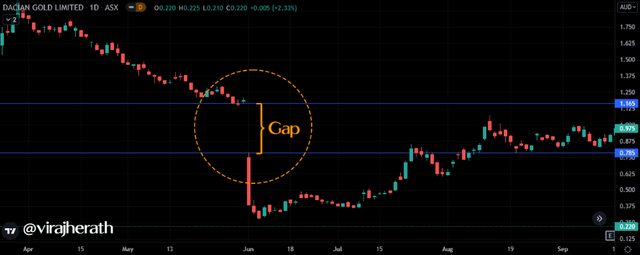
DACIAN GOLD LIMITED | 1d | tradingview.com
Gap illustration on a trading chart
In above figure you can clearly see that there was a Gap down. On May 31st when the candle close, the lowest price indicated was 1.165, and the next candle's highest price trade was 0.785. Thereby the gap between prices was 0.38 cents which leaves a gap on the chart with no trading between.
Such gap is expected when there is sudden market movement occurs with high volume of liquidity (buy or sell).
Explain the types of Gap
There are 03 Gap types which differ from each other based on the context in which they occur and the signal they provide,
Breakaway Gap
This type of Gap can be seen at the end of the current price pattern and indicates a beginning of a new trend. Since it's a sign of a beginning of a trend this gap type consider as the most profitable gap for trading.
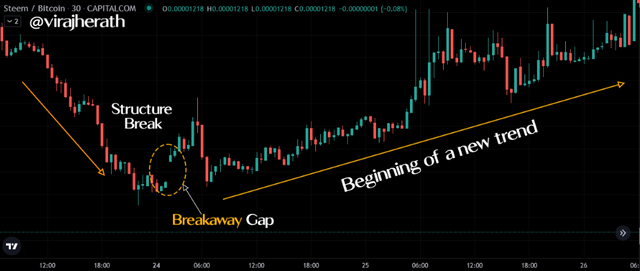
STEEM/BTC | 30M | tradingview.com
Breakaway Gap illustration on a trading chart
In above figure you can notice that the current trend has been changed with the breakaway gap and a new trend began. Why this is the most profitable gap is that when we notice the trend reversal and beginning of new trend, traders can easily make their decision to enter or exit from the market. Further, breakaway level can represent strong resistance or support level.
Runaway Gap
Runaway gap appears in the middle of a strong trend as a confirmation of that trend. There can be minor corrections in a strong trend but the trend will continue eventually.
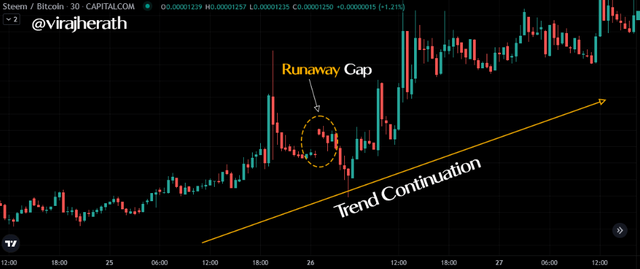
STEEM/BTC | 30M | tradingview.com
Runaway Gap illustration on a trading chart
In above figure you can clearly see that in the middle there is a gap and then sudden price correction occurs. Unlike Breakaway Gap, trend continues in its upward direction to its peak. If it's reverse this could have been a breakaway gap. Since this is a confirmation to the current trend, as a trader we can hold our positions.
Exhaustion Gap
When the trend is exhausted at the very end, Exhaustion gap occurs. This gap has similar characteristics to the runaway gap. However, what we have to notice here is that the position of the gap. After many attempts to reach higher highs or lower lows depending on direction of the trend, price will make one last attempt to move to higher high (if it is a uptrend) or lower low (if it is a downtrend) and will not sustain the momentum long. Thereafter, two scenarios can happen to the trend,
- Trend reversal may occur immediately,
- Price may consolidate in a congestion area for some time,
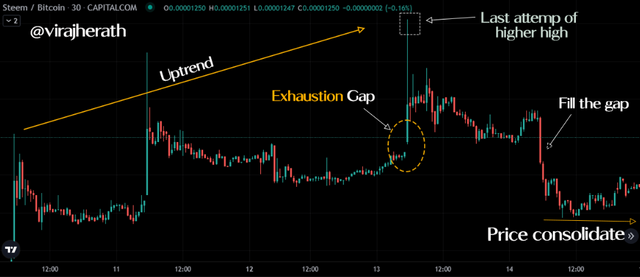
STEEM/BTC | 30M | tradingview.com
Exhaustion Gap illustration on a trading chart
In above example you can see that the trend was on uptrend and then we have a clear gap on price. The price swings to highest point and then consolidated later. This gap could take as a signal to exit from the position because once the price reach to it highest point we can expect the two scenarios it may bring.
Perform the (buy/sell) through Strong Supports and resistances
As crypto prof. @allbert suggested I'm going to use BRB- Break Retest Break Strategy for my trading strategy.
- Trade 01: BUY ORDER | Strong Supports and resistances
I have used 01 min time frame for FLM/USDT pair on Binance Exchange with the 1:1 risk reward ratio for my first trade.
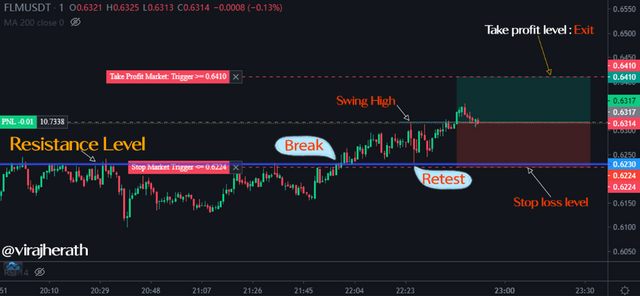
Buy trade entry: Binance FLM/USDT 01 Min chart
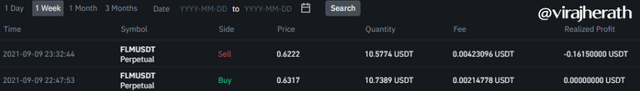
Transaction details of the trade
Trade was a unsuccessful as it hit the stoploss level.
- Trade 02: SELL ORDER | Strong Supports and resistances
I have used 03 min time frame for ETC/USDT pair on Binance Exchange with the 1:1 risk reward ratio for my second trade.
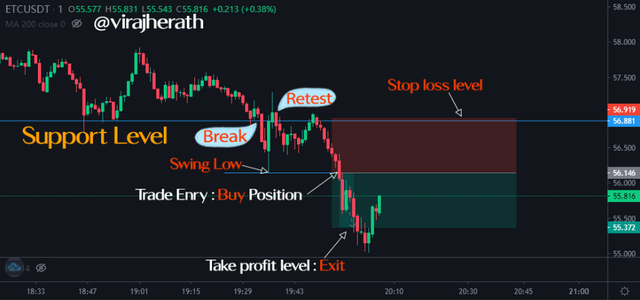
Sell trade entry: Binance ETC/USDT 01 Min chart
Trade was a success and market trend continued as planned.
Perform the (buy/sell) through Gaps levels
- Trade 01: SELL ORDER | Gaps levels
I have used 03 min time frame for REN/BTC pair on Trading view with the 1:2 risk reward ratio for my gap level trade. I took more risk than the previous occasions as this was done through a demo account.
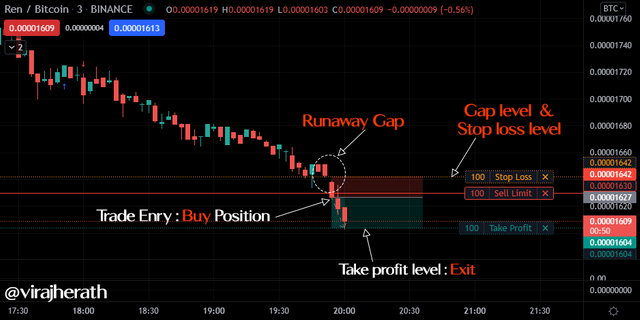
Sell trade entry: Trading view REN/BTC 03 Min chart
Trade was a success and market trend continued as planned.
Conclusion
Knowing how to correctly identify the support and resistance level is key for a successful trade. No matter how many indicators we use to analyze the chart this simple concept will give a more accurate picture of the market instantly.
In this lesson, I have gained useful knowledge on how to identify the weak and strong support and resistance levels including gap levels. Gap levels are classified as breakaway, runaway and exhaustion. According to where they appear on a trading chart these gaps will typically indicate different outcomes.
Finally, with this lesson's knowledge, I have done 3 trades. For the strong resistance and support level trades I used the BRB strategy. The gap is not a scenario which happens every now and then, hence it is important to use indicators which can confirm the trend for a more success rate for our trades with profit.
Thank you prof. @allbert for your well structured guidance on this lesson.
Interesting explanation About Trading with Strong, Weak and Gap Levels. Congratulations and good luck to you in taking the course at Crypto Academy. Great
Thank you for the wishes @tucsond
You're Welcome My Friend