Steem Users and Whales Time of Day Activity Report

What is a best time to post to increase payouts? What is a best time to post to increase upvotes and comments? When are other authors most active?
Disclaimer
The data and visualization in this post may contain errors and inaccuracies. Don't make important decisions without verifying data yourself. If you have any suggestions or found an error in the data, please get in touch with me on steemit.chat.
The "best" time to post
- 7:00-10:00 PST -8h
- 10:00-13:00 EST -5h
- 15:00-18:00 UTC/GMT
- 23:00-2:00 CST +8h
The "worst" time to post
- 23:00-2:00 PST -8h
- 2:00-5:00 EST -5h
- 7:00-10:00 UTC/GMT
- 15:00-18:00 CST +8h
Why the quotes?
These timeranges would be best and worst only if followers/upvoters/readers are similar to the random sample of all STEEM accounts. As that is most certainly not the case, treat this data as only one of factors used to determine posting time. For example, you probably should not change an enjoyable daily writing routine to conform to it.
How to read
- X axis: UTC/GMT time zone hour of day
- Y axis: activity in percents
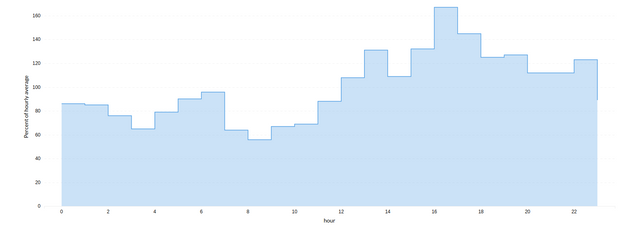
Steem Power holders activity by hour
- All events from the report are between 2016-10-31 and 2016-11-14
- Events are not separated into the weekdays/weekends groups
- If STEEM account performs one or more actions(post, comment, vote, follow, reblog) during one minute, it is considered active during that minute.
- All active minutes are grouped by the hour part of the timestamp, active account vesting_shares (also known as STEEM Power) are multiplied by the number of active minutes for that account and hour part and then summed up for all accounts.
- The value for each hour is then converted to the percentage of average values for all hours.
- SQL queries are not that easily explained in English
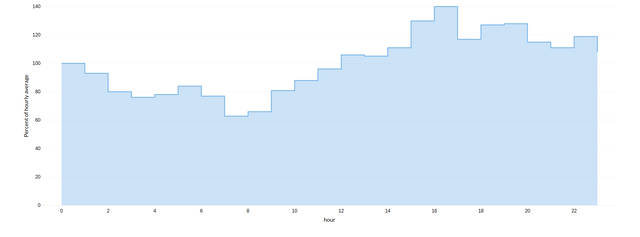
Steem users activity by hour
- All events from the report are between 2016-10-31 and 2016-11-14
- Events are not separated into the weekdays/weekends groups
- If STEEM account performs one or more actions(post, comment, vote, follow, reblog) during one minute, it is considered active during that minute.
- All active minutes of users are grouped by the hour part of the timestamp.
- The value for each hour is then converted to the percentage of average values for all hours.
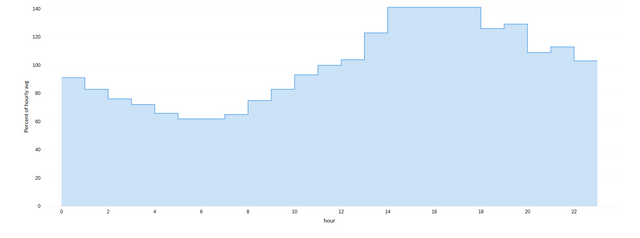
Steem posting activity by hour
- All events from the report happened between 2016-10-31 and 2016-11-14
- Events are not separated into the weekdays/weekends groups
- Number of posts (not comments) grouped by tge hour part of the timestamp.
- The value for each hour is then converted to the percentage of average values for all hours.


Very helpful, indeed. Thanks a lot for sharing. From now on I will block the 15:00 to 18:00 UTC slot for Steemit :-).
I find the payouts very random and can be quite disheartening after putting a lot of work into an article.
Thanks for this interesting analysis.
As an example this great post only got 49 cents after 3 days. There is something wrong with the reward system in Steemit!
Hi, @ontofractal - Thanks a lot for this helpful analysis! It has always been puzzling to me how different my results can be seemingly based on random factors... ;)
Hey @creatr, yeah, payouts are heavily dependent on actions of a small number of accounts so uncertainty is a given.
nice 👍
thx
Very interesting, thanks for sharing!
Maybe could you put the three curves on the same figure, the integrals below the curves being all normalized to one? This should exhibit a strong correlation :)
I'm not sure I could easily do that with my current visualization tools. I've never used this method of normalization though, could you maybe point to a resource to learn more?
Do you have access to the integral below the curve (or the sum of the content of all bins)? If yes, then it is sufficient, for each figure, to divide each bin by this sum and then superimpose the three resulting curves in one single figure.
I am not aware of any existing material on this. I am usually using either matplotlib or root for plotting, using homemade codes.
Yeah, that's very close to what I've done. For each chart I've divided each bin by the average of all bins for this chart and multiplied by 100.
Superimposed three in one chart looks a bit messy as shapes of the curves are very similar.
That was the point I was actually suggesting to make it clearer: we have a strong correlation :)
good info! thanks
Would it be safe to assume that the "Best" EST correlates to 10am-1pm on any given day?
As data includes only last two weeks and there is a significant variance in high SP account engagement, I would say it is not safe to assume that for individual posts on one given day. On the other hand, It would make sense to post daily series during the "best" time of day.
As an hypothetical example, just one active discussion by @dantheman and @ned on a Saturday morning would significantly skew the aggregate results.
What ever happened to the CatchAWhale site (http://catchawhale.com/) that @blueorgy setup? It seems to not be working. I liked that site a lot!
trevligt