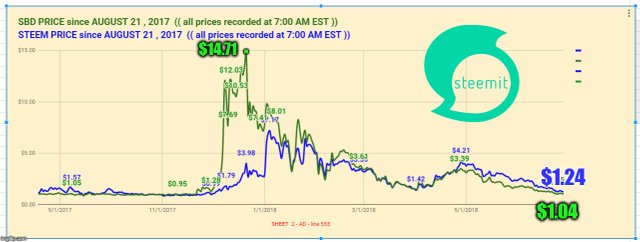
SBD - STEEM overlay chart <<>> (( ALL PRICES RECORDED AT 7AM EST )) June 28 , 2018
🐒 I have overlaid the SBD / STEEM price on the same chart to see how they have moved in price comparison over time since August 21 , 2017 to today.
🐒 ( ALL PRICES RECORDED AT 7AM EST ) therefore there is no daily highs or lows just the price at 7AM EST
🐒
Below comparison chart
GREEN LINE : SBD
BLUE LINE : STEEM
🐒
🐒 Until I put this chart together I had not realised how SBD had outperformed STEEM in December 2017
🐒
DISCLAIMER : This content is for informational, educational and research purposes only.
Please get the advice of a competent financial advisor before investing your money in any financial instrument.
It is strongly recommended that you consult with a licensed financial professional before using any information provided here . Any market data or news commentary used here is for illustrative and informational purposes only.
Trading involves a high level of risk. Future results can be dramatically different from the opinions expressed herein. Past performance does not guarantee future performance. Consult an investment professional before investing.
All ideas , trade signals , opinions and/or forecasts are for informational, educational and research purposes only and should not be construed as a recommendation to invest, trade, and/or speculate . Any investments made in light of these ideas, trade signals, opinions, and/or forecasts, expressed or implied herein, are committed at your own risk. I am not an investment advisor, information shared here is for informational, educational and research purposes only and not a recommendation to buy or sell anything .
This user is on the @buildawhale blacklist for one or more of the following reasons: