USDJPY Big Fall Happening
Hello Traders
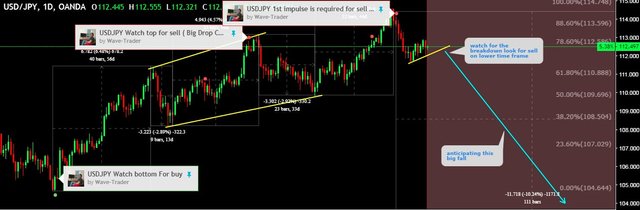
A big fall seen on chart.
How you can trade on this chart.
This is a daily chart . You should watch lower time frame for better entry.
- It is forming daily flag.Within that daily flag it can go back up for one more bullish wave let the wave happen and then look for sell from new high within that flag.
Or
- Watch lower time frame correction like 30 minutes and then look for that correction to breakdown and go down.
In case this daily flag is not going tho breakdown and price is going to test back the previous high then we will be seller again from previous high as i said we are longer term bearish on it.