You are viewing a single comment's thread from:
RE: Historical rates for VESTS and STEEM
Thanks, it's useful to see this! The data seems to be surprisingly variable though. Here's the last 3 months worth of data, and it shows a clear weekly pattern (some but not all of the time).
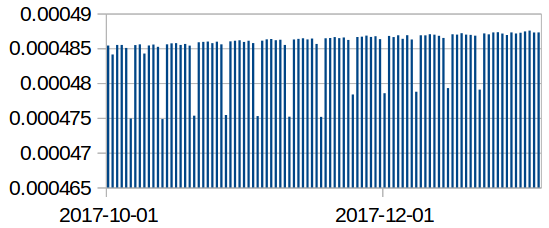
Is it that I don't properly understand the Steem mechanics that are causing this, or are the weekly dips a data problem?
I'm taking a shot in the dark here - but I'll bet there's a large account that's powering down on that date that's swinging the average. It might even be someone still powering down on the old 102 (?) week powerdown schedule?
You're right though, that's interesting. I wasn't looking for this data for trend patterns (thus no chart), it was meant to be more of a lookup table for those who are dealing with EOY tax processes.
Interesting theory, but if that were the case we'd surely see more variability in the other days of the week too. I can't quite understand how power-down events affect this rate anyway? Perhaps the mechanics of the 102 week power-down are different in some way? In any case, if this data is valid, then some days are slightly better for powering down than others, which seems quite strange.
I have assumed linear interpolation between certain time points for the steemreports financial tools, so wanted to see how accurate that was, and this has confused me a bit! ;)
Well, VESTS are just a representation of your ownership over the
total_vesting_fund_steem, so when the vesting fund takes a massive hit (from a large powerdown), it's bound to affect the overall value of each VEST in some way. You'd think it would be proportional and wouldn't impact it - but maybe there's something strange happening here.I don't have a great answer, but due to the fact that it seems to be once a week (which correlates to a power down), it leads me to believe they're somehow related. Either that or someone is manually doing something else (powering up?) once a week like clockwork :)
Right, yes, it makes some sense to me, and the pattern fits the hypothesis. I'll have to think about it more though. Thanks.