Trading with the Market Bias Indicator (Trend Indicator)
Greetings my dear friends and crypto traders. I'm delighted once again to share with you all yet another interesting article today which I titled Trading with the Market Bias Indicator (Trend Indicator).
After meeting a lot of people recently through charts and physically, I discovered that they all have one problem and that is identifying the market trend.
This has been the major challenge of many who send me a message asking when they should long or short the market. Based on these, I have decided to share with us another trend-based indicator that works like magic.
This indicator won't give you a buy or a sell signal, it will only give you the current trend of the market. So through this post, we are going to see how one can identify these trends and then know if to buy or sell the market.
Market Bias Indicator (Trend Indicator)
As I have said earlier, this is a trend-based indicator that tells traders the current trend of the market at any point and time. To trade the market, you will have to know the direction of the market. This is to avoid counter-trade.
The Market Bias indicator has been designed to communicate this information to the traders. So in this lesson, we will see how to identify the bullish trend, the bearish trend and the sideways market.
For the sake of those who don't know, you long or buy when the market is in a bullish phase i.e. when the price is going up you are supposed to be buying the market whereas when the price is going down you are supposed to short or sell the market.
On both sides you still make good money all you need is a proper prediction of the price either it will go up or come down. When your prediction is right, then you will make a huge amount of money in the market and that is what futures trading is all about.
Adding and setting Market Bias Indicator
Adding indicators to a chart from the tradingview.com website is done in a similar way the only difference we see often is the settings done on each of the indicators to make it work effectively with our strategies. So we are going to use the same procedure to add the same indicator.
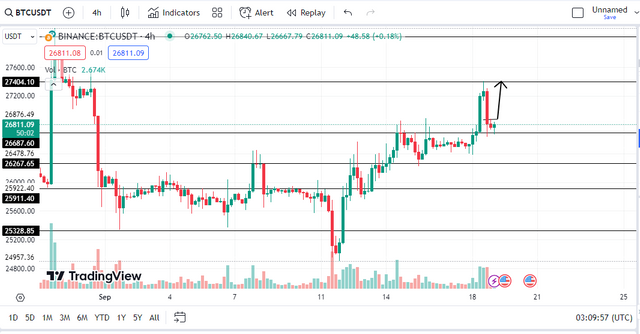
Step 1: Go to TradingView.com and select a pair of crypto assets. Here we selected BTCUSDT on a 4H timeframe as seen in the screenshot below
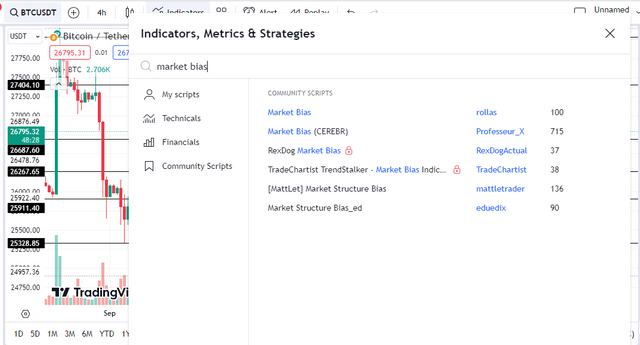
Step 2: Go to Indicator and search for the Market Bias Indicator on the search bar as seen in the screenshot below and then click to add it
Step 3: Check to be sure it has been added after clicking on it as seen in the chart below.
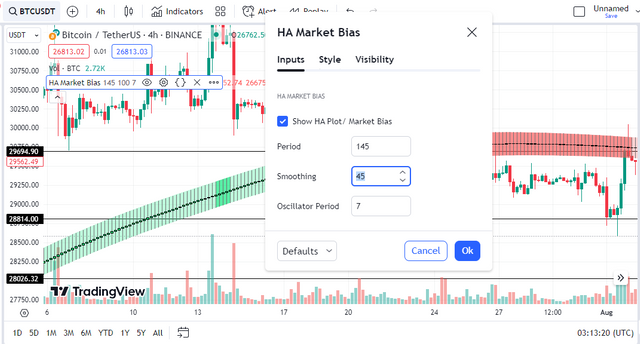
Step 4: Click on settings and then you will see the few settings in the input part. Change the period to 145, Smoothing to 45 and lastly leave the Oscillator period to remain at 7 as seen in the screenshot below.
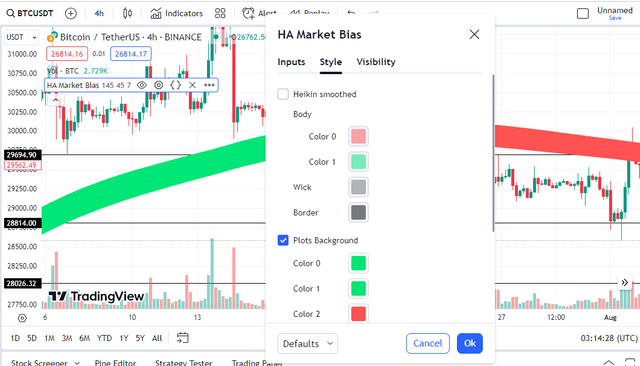
Step 5: Click on style and untick Heikin Smoothed, increase the smoothed background colour to make it more visible as seen in the screenshot below
Step 6: Check the chart to be sure the changes have been effected.
Identifying Bullish Trend using the Market Bias Indicator
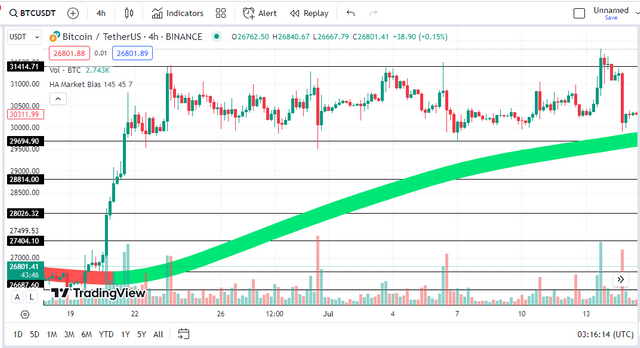
To identify a bullish market using the Market Bias indicator is very simple. Ensure you have added and done the settings I shared above by just looking at your chart you can be able to say if the market is bullish or not.
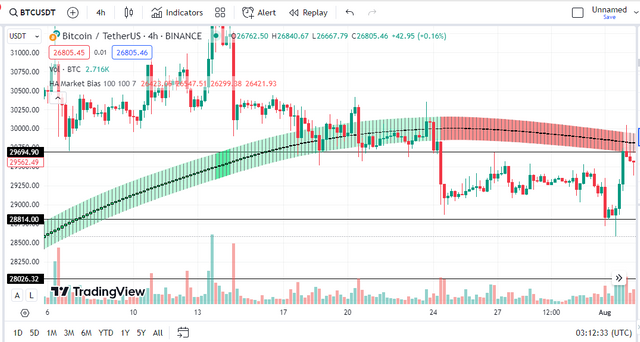
From the above chart, a pair of BTCUSDT on a 4H timeframe was taken into consideration. From the chart, we can see prices forming a list of higher highs and higher lows which means the market is bullish and to get a clear confirmation the indicator was seen as a green bar below the price action.
This is all you need to know about the current trends in the market. If you can't determine the trend using the higher highs and higher lows, then check to be sure that the indicator is green in colour and is seen below the price action.
Identifying Bearish Trend using the Market Bias Indicator
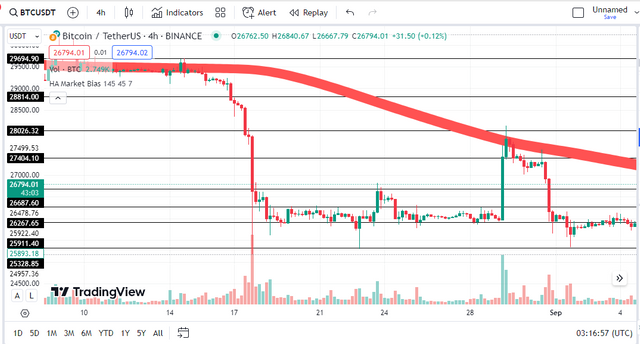
Similarly, identifying a bearish market using the Market Bias indicator is very simple. Ensure you have added and done the settings I shared above by just looking at your chart you can be able to say if the market is bearish or not.
From the above chart, a pair of BTCUSDT on a 4H timeframe was taken into consideration. From the chart, we can see prices forming a list of lower lows and lower highs which means the market is bearish and to get a clear confirmation the indicator was seen as a red bar above the price action.
This is all you need to know about the current trends in the market. If you can't determine the trend using the lower lows and lower highs, then check to be sure that the indicator is red and is seen above the price action.
Identifying Sideways Market using the Market Bias Indicator
The sideways market is another market structure that traders need to be aware of. Myself, I don't trade in this type of market because of the uncertainty in it. Let's look at this market in the chart below.
From the above chart, you will notice the price stocked between a certain level of support and resistance and the indicator shows red and green at some point.
This type of market doesn't give a clear picture of price movement hence I advise traders to avoid trading it. The reason why I brought it up here is so we can be able to identify it using this indicator and then wait for a breakout from the support or resistance level before we can trade it.
Conclusion
The Market Bias Indicator is a trend-based indicator which is used by traders to identify the current trend of the market. It is used to determine if a market is in an uptrend, downtrend or even sideways as we can see in the screenshots above.
The indicator saves people the stress of trying to find out the trend of the market at any point in time. This indicator is more reliable when used in a higher timeframe. Ensure to check the market using a 1D or 4H timeframe to have a clear picture of its direction.
Finally, if you have any questions or contributions please do well to drop a comment in the comment section of my post below. I will endeavour to reply to all of them ASAP. See you all in the next episode of my publication.
Disclaimer: This post is made as an education and not investment advice. Digital asset prices are subject to change. All forms of crypto investment have a high risk. I am not a financial advisor, before jumping to any conclusions in this matter please do your research and consult a financial advisor.
NB: All images except otherwise stated are mine and taken from tradingview.com website

X-Share
Dear @simonnwigwe ,
We appreciate your active participation and contributions to our community. To ensure a positive environment for all members, we have implemented a set of guidelines to maintain respectful and constructive discussions while upholding community guidelines.
Keep sharing quality post with us in our community
Now Engage, Connect, and Inspire Each Other to Reach New heights.
Thank You.