A collection of Steem Stats for September
Active Users
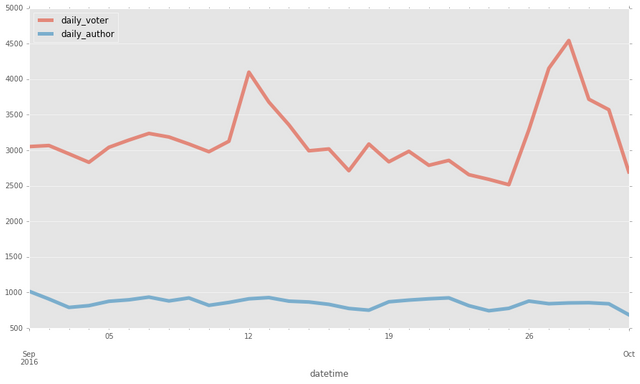
Each account that has blogged, commented or voted at least once in the past month, and has a reputation higher than 25, has been counted here. This way, the bots and users that have been flagged for spam/bad behavior are excluded from the charts.
| Month | Reputation | Bloggers | Voters |
|---|---|---|---|
| September | Any | 6,713 | 17,332 |
| 25+ | 4,330 | 6,356 |
Daily Active Users (25+ rep)
Further Breakdown
Top Authors
Best Paid Authors this month
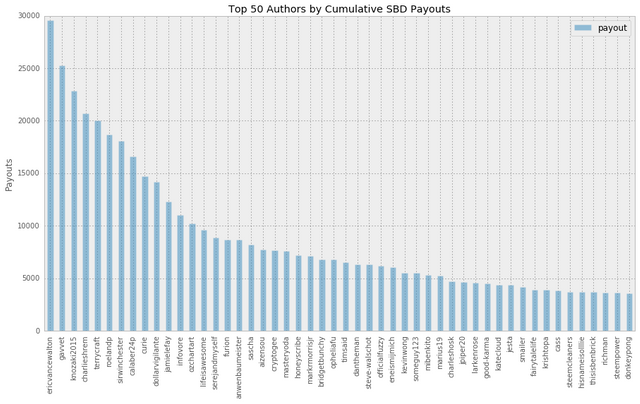
Woohoo, I'm actually on the list ヾ(。⌒∇⌒)ノ
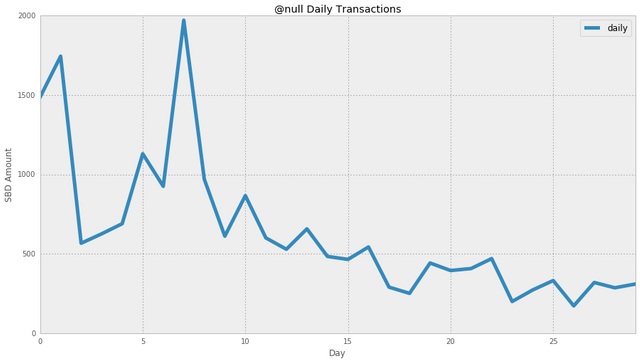
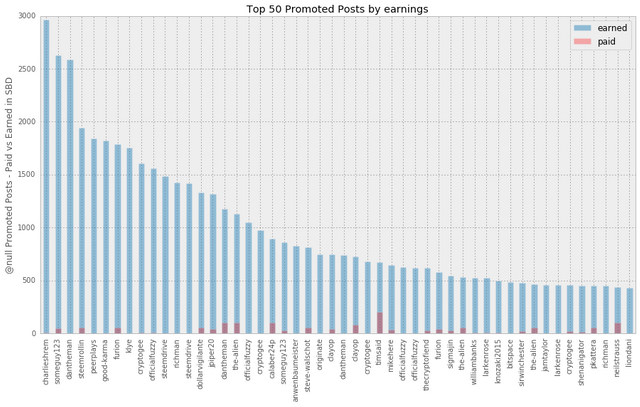
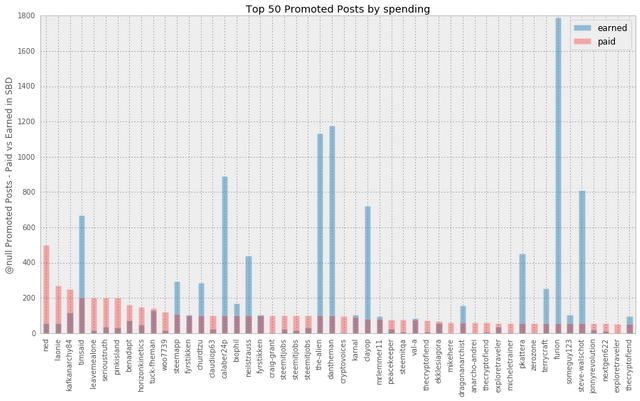
Promoted Content
Daily promoted content spending
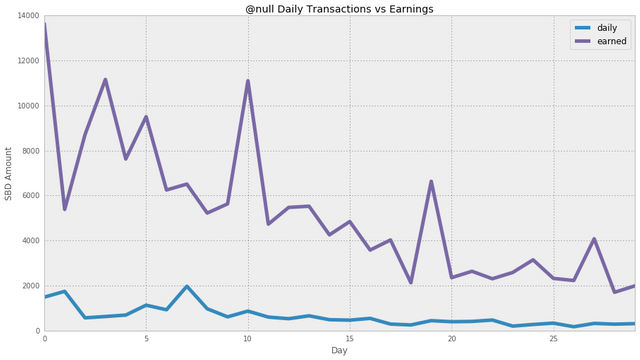
Daily promoted content spending vs rewards
Top 50 Promoted Posts by Earnings
Top 50 Promoted Posts by Spending
Who is powering up?
Daily and cumulative power-ups
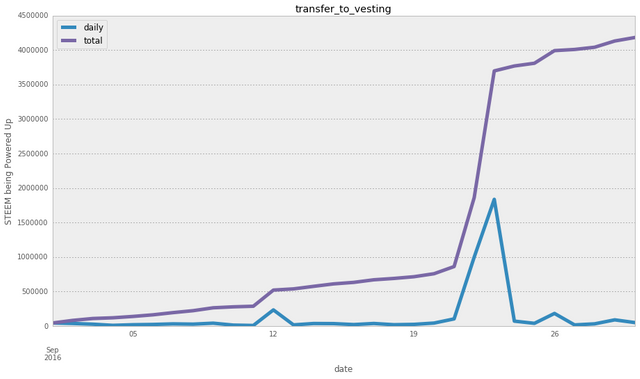
Total SP: 4,186,245
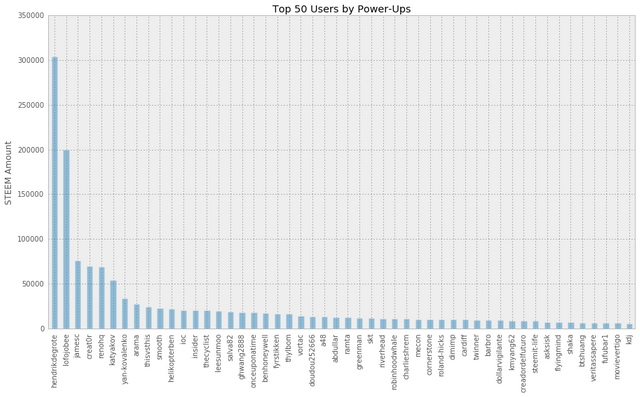
Top 50 users by power-ups
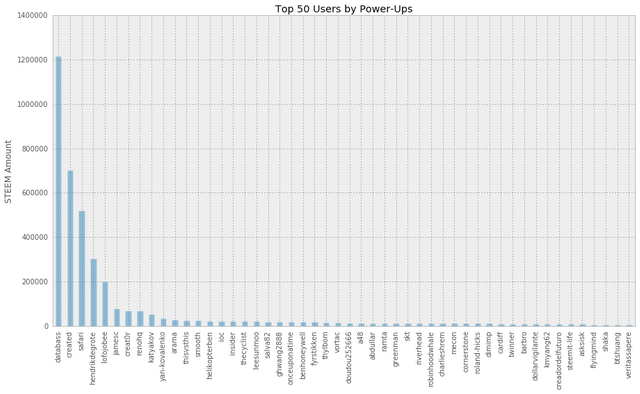
@anyx has pointed out that the top 3 powerups this month (databass, created, safari) were powered up by Steemit and are likely new employees/advisors/etc. If we exclude them, the chart looks like this:
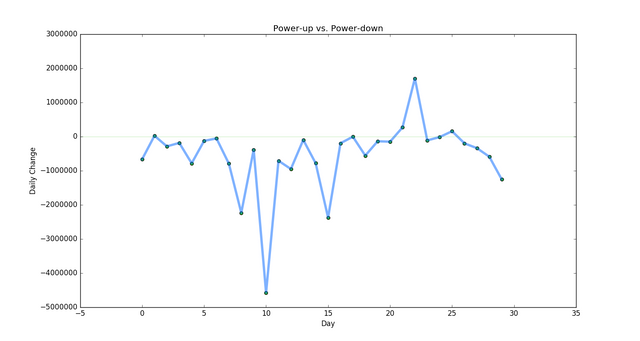
Power up vs Power Down
Daily Delta between power-ups and power-downs
Cap Table
The snapshot for the cap table has been taken on the last day of September.
Classification:
| Class | Short | SP |
|---|---|---|
| Steemit Inc | STM | |
| Mega Whale | MW | 1 Million+ SP |
| Whale | W | 100k - 1M SP |
| High Middle Class | HMC | 10k - 100k SP |
| Low Middle Class | LMC | 100 - 10k SP |
| Minnows | M | Less than 100 SP |
| Dust | D | ~3 SP |
Table
| Group | Users | Cumulative SP | Cumulative Power-Down |
|---|---|---|---|
| All | 99,993 (100.00%) | 163,382,916 (100.00%) | 1,352,212 (100.00%) |
| STM | 1 (0.00%) | 79,467,586 (48.64%) | 892,894 (66.03%) |
| MW | 18 (0.02%) | 35,774,275 (21.90%) | 258,659 (19.13%) |
| W | 107 (0.11%) | 29,951,749 (18.33%) | 136,898 (10.12%) |
| HMC | 404 (0.40%) | 12,010,090 (7.35%) | 49,037 (3.63%) |
| LMC | 1,356 (1.36%) | 4,021,014 (2.46%) | 11,797 (0.87%) |
| M | 25,914 (25.92%) | 1,806,769 (1.11%) | 2,927 (0.22%) |
| D | 72,193 (72.20%) | 351,433 (0.22%) | 0 (0.00%) |
Price Action
You have probably seen STEEM/BTC and SBD/BTC charts already, so I thought I'd show you something new. Here is a 6hr OHLC chart from STEEM/SBD trading on internal market. It took a pretty long time to scrape fill_order history for all active traders, and clean up the data, but it was worth it :)
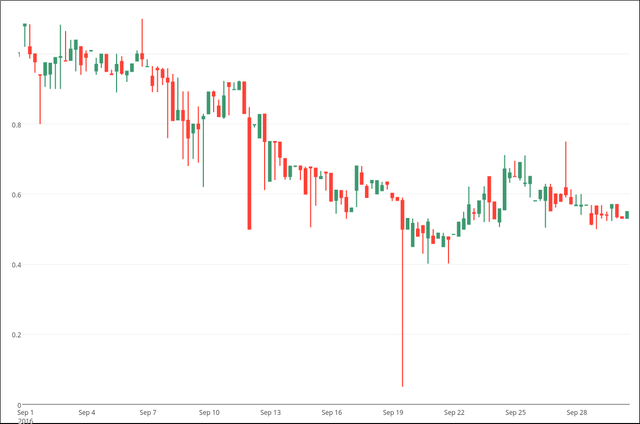
You can play with this interactive chart here
Going Forward
I will be adding more metrics/reports over time. Any feedback is welcome. Which ones do you like, which ones aren't useful, what would you add/change?

Don't miss out on the next post - follow me.
SteemQ | steemtools | steem.li | witness
STEEM/BTC chart was missing, so I had to post it here. We are currently breaking out of the wedge pattern. Next week will be critical. I hope it is a up week.
Hey Whales and @steemit -- any chance we could get a one week reprieve of the dumps just to level out the price before it dips below the start point?
Great work, the more metrics we have the greater the transparency..Your efforts gratefully received @furion
Thanks for the detailed information!
Very good post, continue like this and you will be bigger, follow me and I will follow you
Congratulations. Thank you for posting statistics which do not include bots. A query, is there any data suggesting whether bots are detremental in any way. ie. confidence in data, voting, etc.
Thank you :) Resteemed!
Thanks! I'll be going over this more tomorrow, but this is really great. Thank you for sharing it.
best paid authors this month seems interesting. damn, how come I never thought about it?! :)
Thanks for sharing with us, cheers!
Just wow. I look forward to more stats.