Post Activity Report 4th Sep - 10th Sep
This weekly report provides a snapshot of posting activity on the Steem Blockchain for the past 7 days.
- How many accounts are active?
- Who is posting?
The story this week is a slight increase in activity from the last report.
The Last report is available for comparison Post Activity Report 22nd Aug - 28th Aug

Focusing on the numbers/frequency of posts (i.e. ignoring payouts) we can get a feel for who is posting as well as the level of account activity.
We separately analyse the frequency of posting activity by:
- Reputation of Author
- Steem Power
- Date of Joining
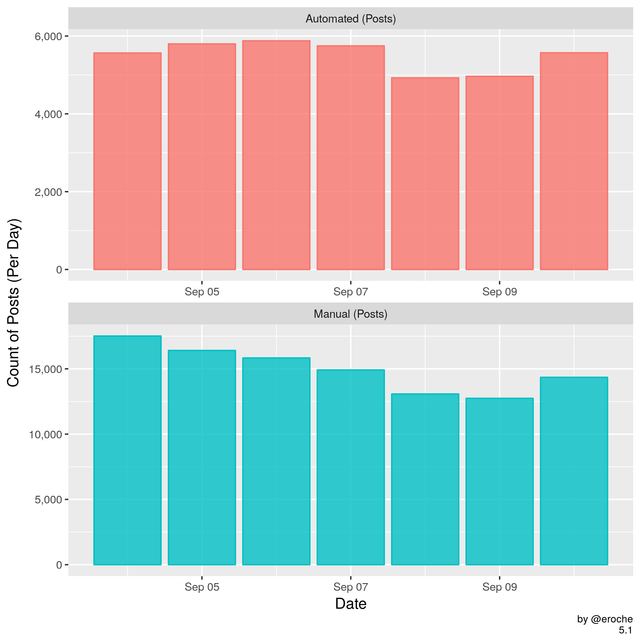
- Automated vs Manual Posts
This Automated/Manual categorisation is based on frequency of posting activity over the last 7 days
The data for this report is sourced from steemsql by @arcange

Posts per Day (ex comments)
In the past 7 days there was a total of 143k posts from 28k unique accounts. That gives an average of 5 posts in the week for authors that were posting. The next graphs shows the breakdown of these figures on a daily basis.
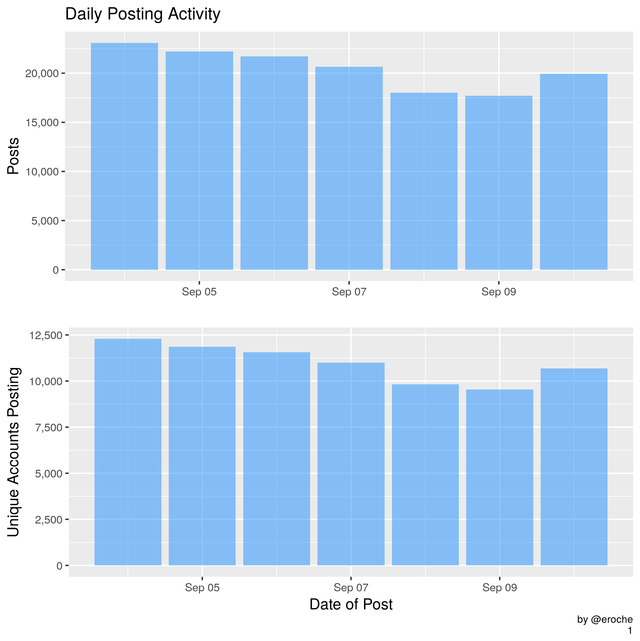
- The mean number of Posts per day was 20.4k
- The mean number of Accounts posting per day was 10.9k
Daily counts give a high level overview but we can examine subdivisions or groups of authors to get further insights into who is posting.
The colour in the following graphs represent different cohorts of Steemit Accounts.
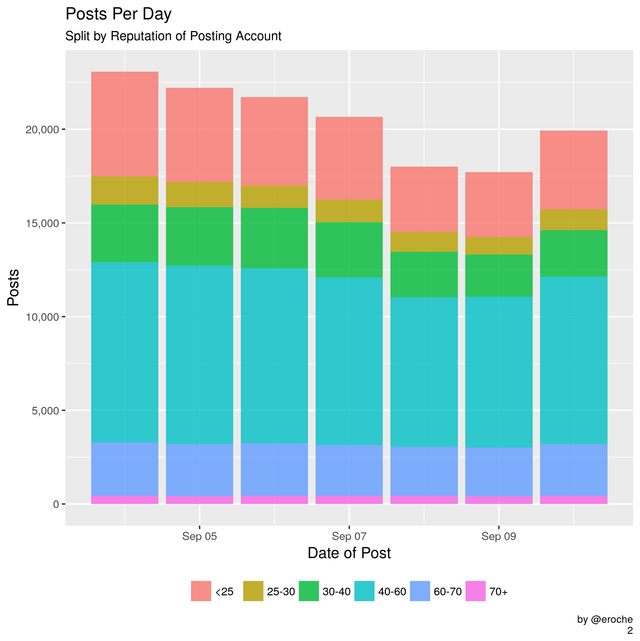
Reputation
It can take a while to build your reputation and the system is designed so that it is easy to lose it. You don't want to get downvotes from people with higher Rep!
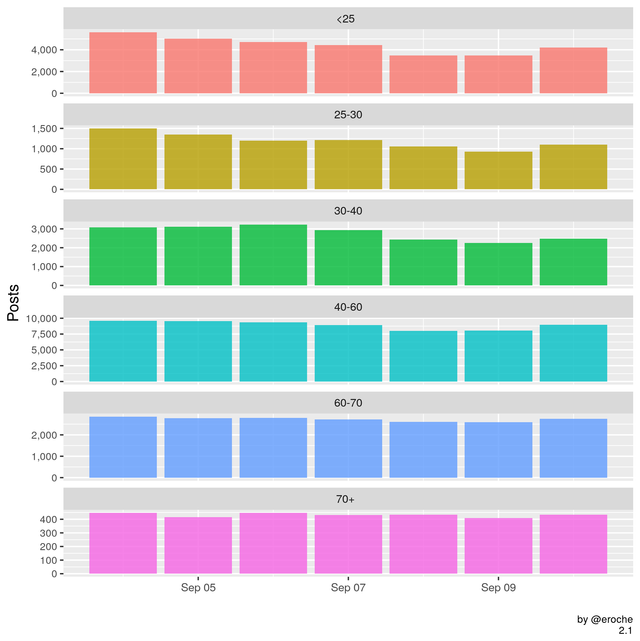
The next few graphs examine how many posts per day are made by people of different Reputations.
Total
Breakdown
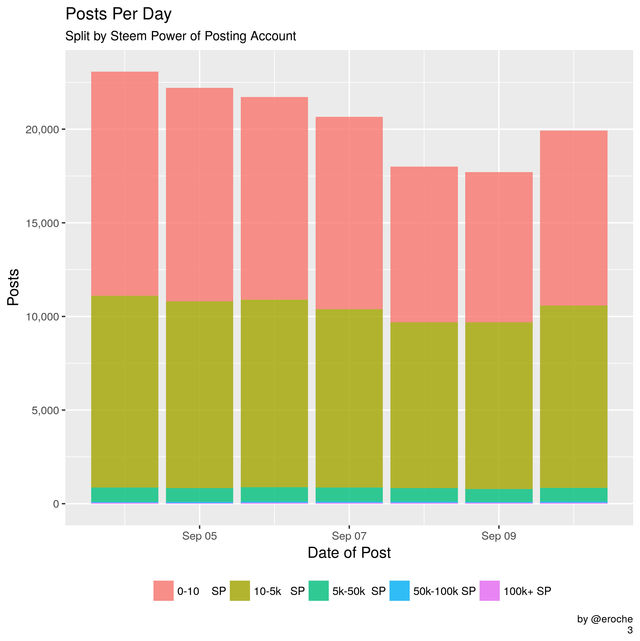
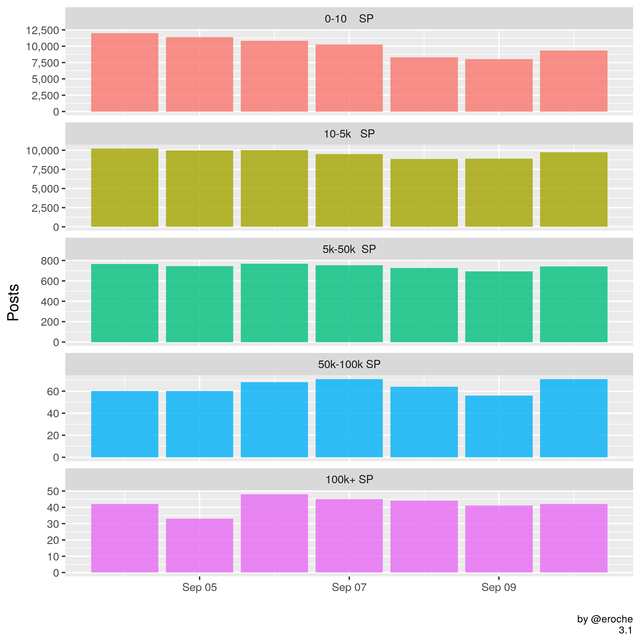
Steem Power
Steem is a stake weighted platform. If you have more stake your vote is worth more.
The next few graphs examine how many posts per day are made by people with different levels of Steem Power.
Total
Breakdown
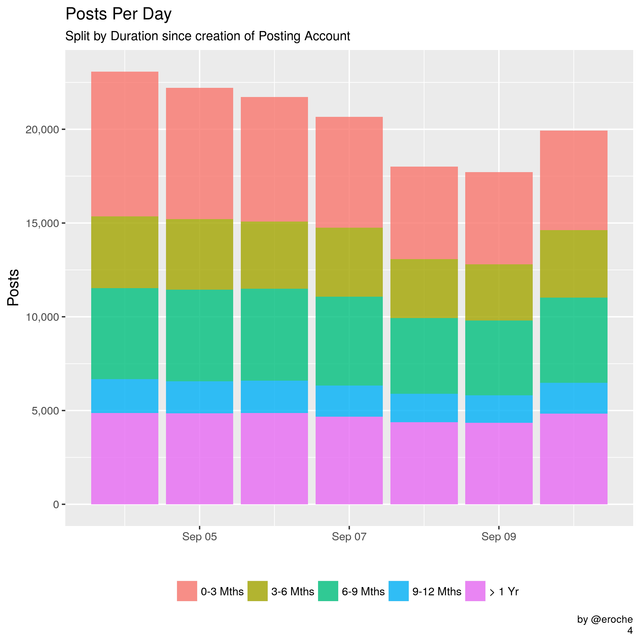
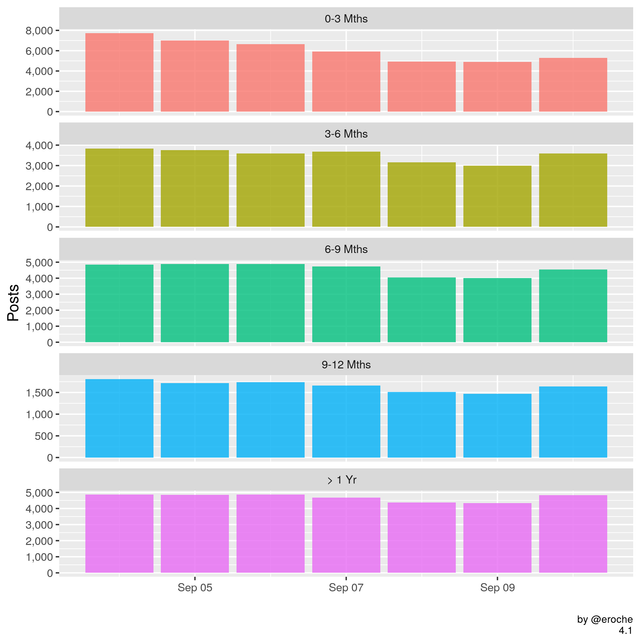
Account Duration
The first accounts were created in April 2016. We are now over the 1.1m account mark. Absolute number is important but retention is also important.
- How many people who joined over the course of the last year are still posting?
- Who is creating the bulk of the daily content?
The next few graphs examine how many posts per day are made by people that have been on Steemit for different lengths of time.
Total
Breakdown
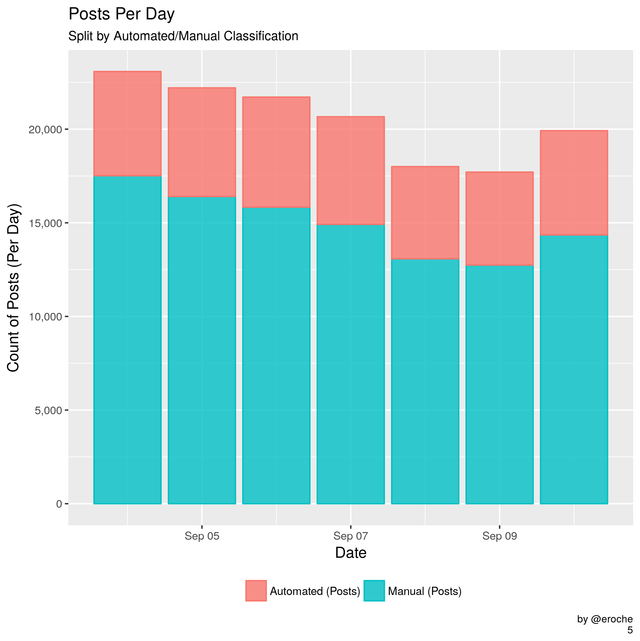
Automated Accounts
If there is one, what is the number of comments a day that we could use to identify automated accounts?
I would propose anything higher than 4 posts per day (on average) uses some sort of automation. This number may not be correct but it's a starting point for our analysis.
Automated accounts may post daily reports or in some cases may just be people spamming the system with low quality content or content copied from other sources. Not all automated posts are bad and some provide a useful function such as daily statistics, market analysis etc. Splitting out these automated accounts will be more relevant for comment activity however it's also worth tracking for posts.
The next few graphs examine the daily posts that are in some way automated.
Total
Breakdown
If your looking for more daily statistics:
- @arcange produces daily reports with really useful data.
Interactive tools
- https://steemworld.org/ by @steemchiller
- https://helloacm.com/tools/steemit/ by @justyy
- https://tool.steem.world/ by @segypark
- https://steemdb.com/ by @jesta
- http://steemreports.com/ by @steemreports
- https://eroche.shinyapps.io/SteemAnalytics/ by @eroche
You may also wish to check out the following tag
- #blockchainbi and the members of the @Steemitbc community, spearheaded by @paulag, produce detailed analysis on all things related to Steemit.
What area of this report did you find most useful?
I would love any feedback to improve or clarify any of this analysis.
Thank you for reading this. I write on Steemit about Blockchain, Cryptocurrency and Travel.
Thank you for sharing - really valuable to be data led and your insight and analysis into the data is really valuable. Is it usually the case that posting activity falls at weekends?
These are great. I'm happy to see green shoots are starting to show. By that I mean the amount of posts going up. With the price of steem quite low it is encouraging that interactions are increasing.
Completely of point but I would love to see some stats on the use of the memo function. Like how much is paid to use it as a promotion tool. I get lots of memos advertising bots/ upvote services and have always woundered what impact this has on the network regarding useage of resources
I'd be interested in seeing some analysis.
I havent seen any stats on the Memos. That would be very interesting to look at. In terms of activity we could look at number of memos per day and also the breakdown that are transfers to upvote services. I will have a play around with it at the weekend and see what I can come up with.
Cool, I'd love to see how much I've earned for being spammed at.:)