Market Update on Silver (XAG & SLV) 3/19/2018
Voila! We go lower. OK, so where do we go from here and is this sell-off crap over?
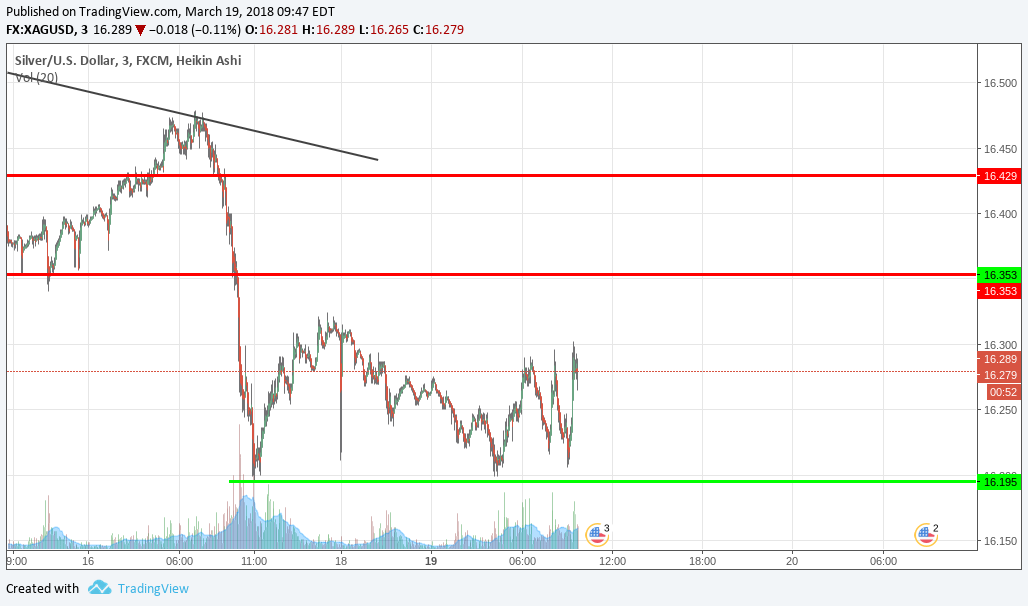
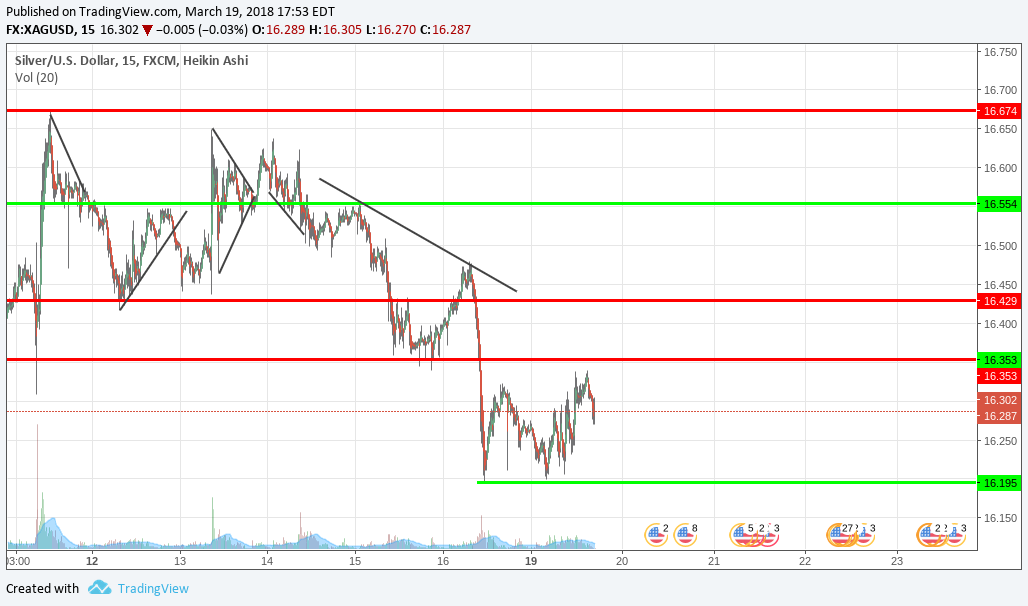
On a 3m XAG chart price action suggests we are going to test the 16.353 level at least once before finding out where bottom is.
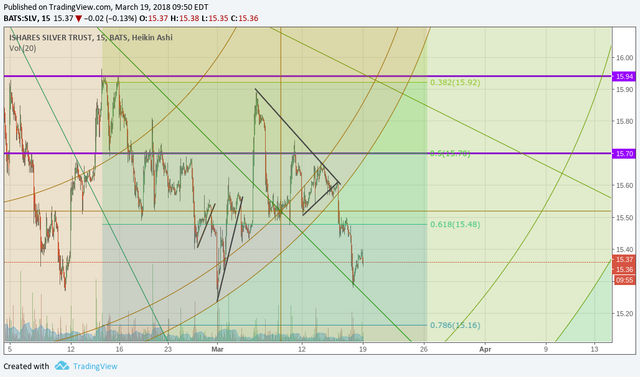
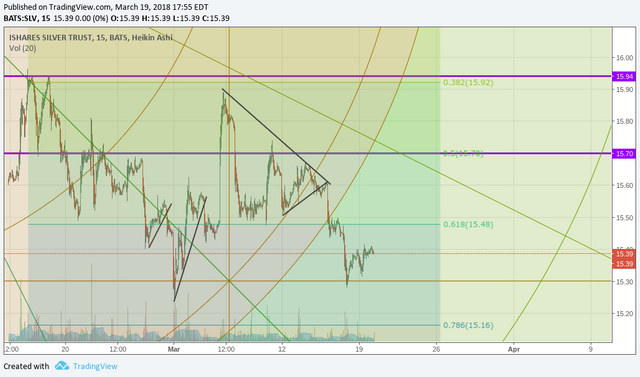
The 15m SLV chart is giving us a more definitive narrative at the moment. It is saying "I'm going to see where the bottom is now!" So by a vote of 2 to 1 the charts say silver is going to test or find a new bottom. It should chop around for the rest of the day so you have time to figure out what you want to do.
Sort: Trending
[-]
dankh (57) 6 years ago
[-]
dankh (57) 6 years ago