SPDR Sector Relative Strength Analysis Report For Week Starting 7/22/19

Sector rotation is the action of shifting investment assets from one sector to another to take advantage of cyclical trends in the overall economy in an attempt to beat the market. Sector rotation seeks to capitalize on the theory that not all sectors of the economy perform well at the same time because sectors of the stock market perform differently during the phases of the economic and market cycle.
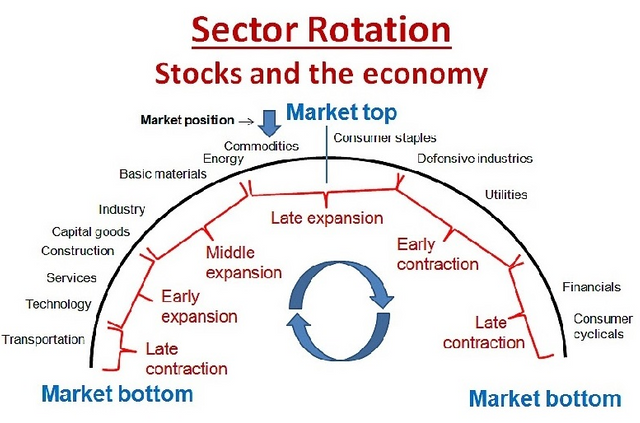
For example, defensive sectors such as consumer staples, utility and health care stocks tend to outperform during a recessionary phase, while consumer discretionary and tech stocks tend to fare well during early expansions.
When you trade, you want the strongest stocks in the strongest sectors, which is why you should monitor sector performance carefully. With that said, lets determine the relative strength of the sectors relative to the S&P 500 ETF, SPY for the upcoming week.
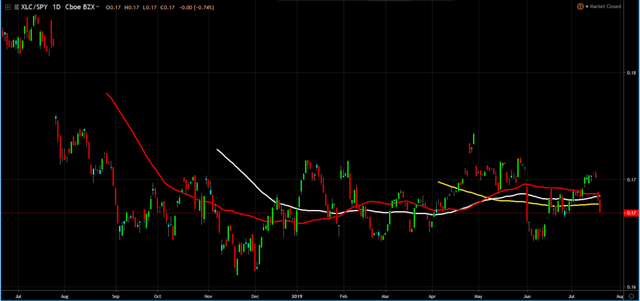
Communication Services (XLC)
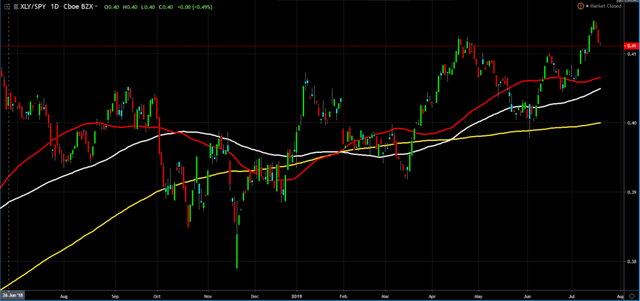
Consumer Discretionary (XLY)
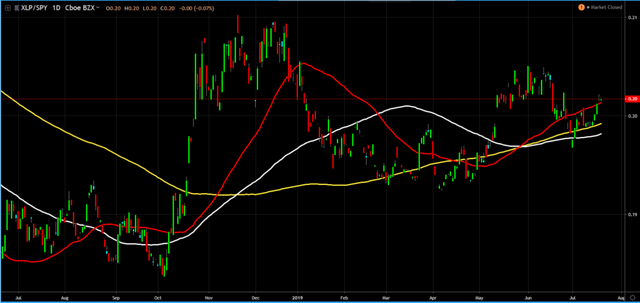
Consumer Staples (XLP)
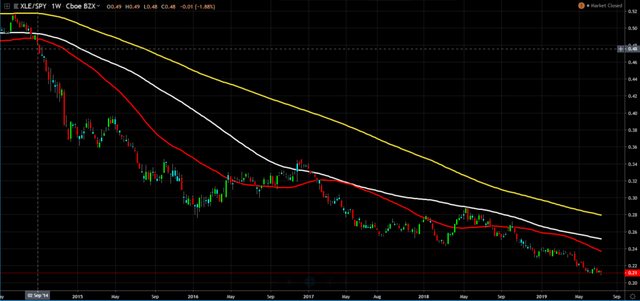
Energy (XLE)
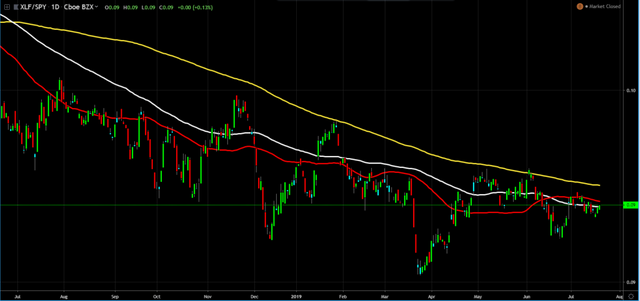
Financials (XLF)
Health Care (XLV)

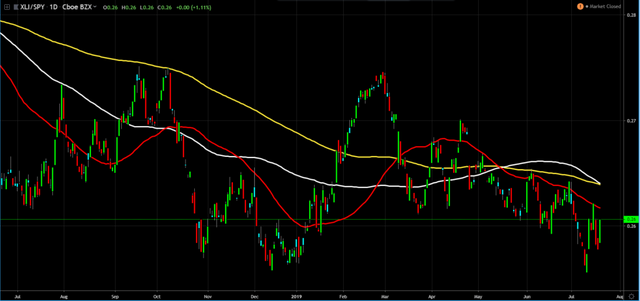
Industrials (XLI)
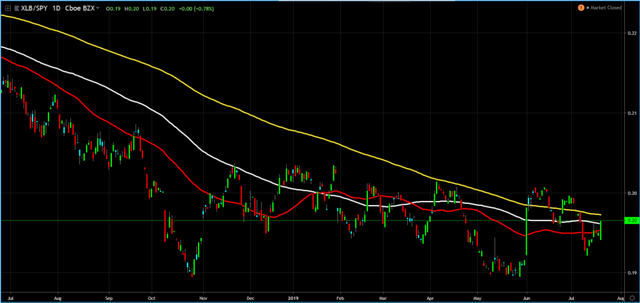
Materials (XLB)
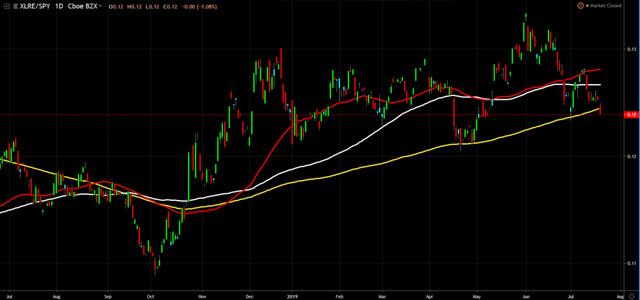
Real Estate (XLRE)
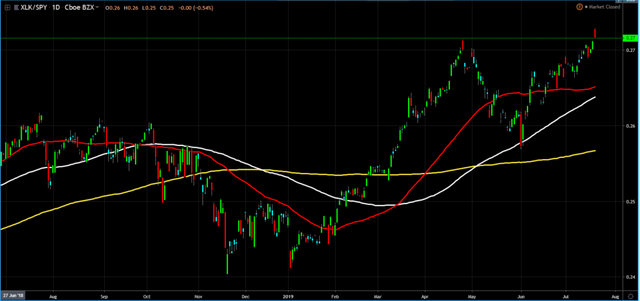
Technology (XLK)
Utilities (XLU)
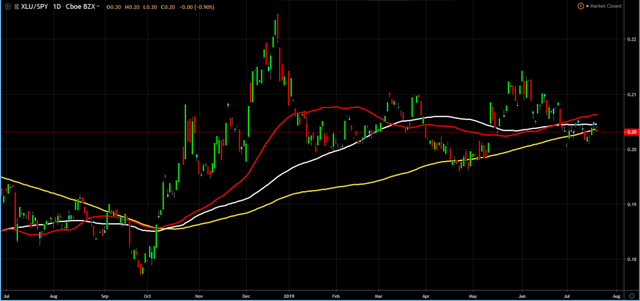
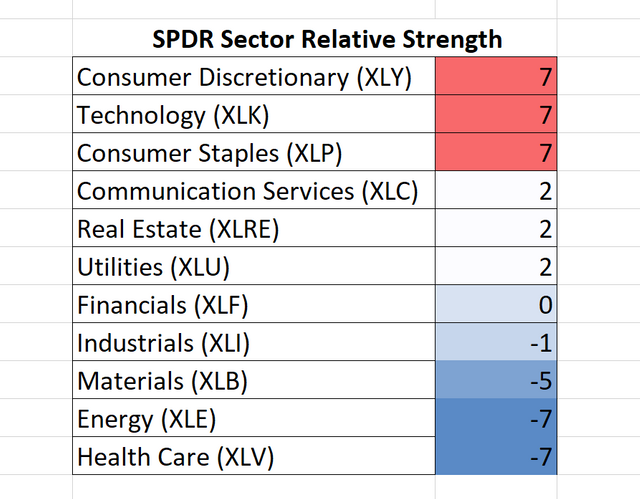
Based on the moving averages and the last daily closing price, relative to the moving averages,
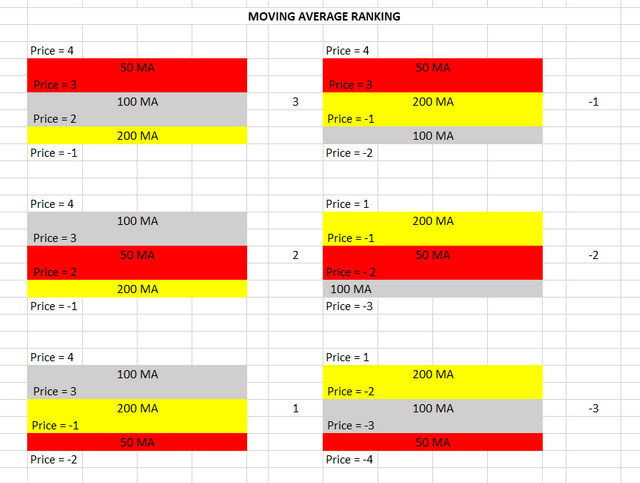
the SPDR sectors' relative strength, relative to the SPY are the following:
This post is my personal opinion. I’m not a financial advisor, this isn't financial advise. Do your own research before making investment decisions.


Good information. I follow the RSI as well as momentum and although I follow the sectors, I have not completely rotated out of one into another.
I resteemed do I can reread your post.
Posted using Partiko Android
RSI is a good objective indicator, but sector rotation is like RSI on steroids.
Thanks for the resteem @plemmons.
Amazing to see these downtrending charts and see that we remain within a couple of percentage points from more highs! Just shows how imbalanced the market has become which I think is a sign of being unsustainable in my opinion.
What's interesting is since I started doing this analysis, I didn't know the energy sector was so weak despite the rise in oil the last couple of year. Had I done this years ago, there were some great shorts in the energy sector, now one has to be more selective if considering a short.