Trading with Accumulation / Distribution (A/D) Indicator - Crypto Academy / S4W5 - Homework Post for @allbert

Cover App Created by me, @msquaretk | Canva App
It is week 6 in the Crypto Academy. Hello Stemians.
This post is written in response to Professor @allbert 's homework. He taught "Trading with Accumulation / Distribution (A/D) Indicator." So, I will be attending to the questions one after the other. Follow me closely.

Question 1
Explain in your own words what the A/D Indicator is and how and why it relates to volume. (Screenshots needed).
A/D indicator simply means accumulation/distribution indicator. It is an indicator which is used to determine the accumulation and distribution phase of an asset. A/D Indicator was developed by a man known as Mark Chaikin. It is an indicator which comprises of a single line which oscillates up and down.
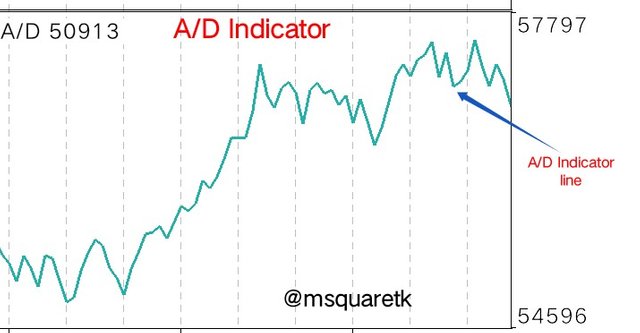
Fig. 1: A/D Indicator | Mt4 Platform
To understand this indicator very well, there's a need to know what accumulation and distribution are. The word accumulation is used in finance trading when an asset is being acquired by many traders and hold the asset with the sense the the price of an asset. Whenever there's accumulation, it is an indication that people are "pumping" money to acquire a particular asset and that after the end of accumulation phase, the price of an asset will shoot up.
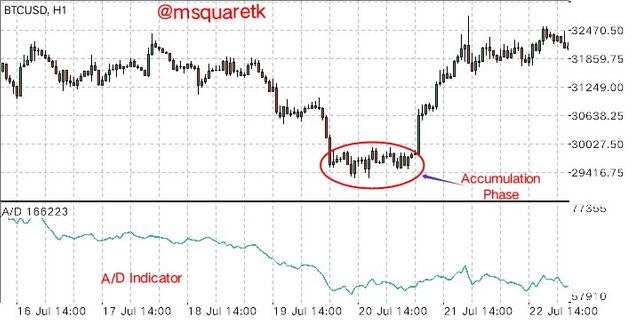
Fig. 2: Accumulation Phase on the Chart of BTCUSD | Mt4 Platform
On the other hand, distribution happens when the price of an asset has been overpriced, that's when it is totally overbought. At this stage, traders who have bought the asset in the accumulation stage begin to exit the market because they know that the price will experience a fall.
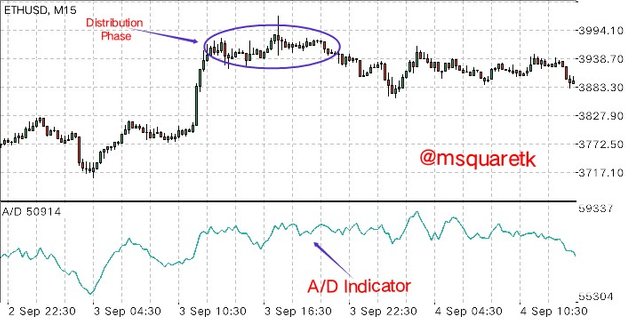
Fig. 3: Distribution Phase on the Chart of ETHUSD | Mt4 Platform
So, what A/D Indicator does is that, it shows the phase of accumulation and distribution of an asset on the chart. A/D Indicator does this by using price and volume. Simply put, A/D indicator determines how money flows progressively into or out of an asset by the use of its price and volume. Hence, A/D Indicator is referred to as volume-based indicator.
A/D Indicator is usually added to the chart and when the the indicator is rising and the price of an asset is in an uptrend, it shows that traders are holding and buying the asset and when the indicator is declining and the price is also falling, the traders are distributing the asset. This indicator is useful in the sense that it can be used to predict the change in trend. It has what is known as divergence which traders use mostly.
When divergence occurs, it shows the exhaustion in the current trend. To be more clear, when the price of an asset is in an uptrend showing series of higher highs and the indicator goes the opposite direction, then the buyers are being exhausted and the uptrend may be coming to an end. Also,when the price of an asset is a downtrend, showing series of lower lows and the indicator goes the opposite direction, the the downtrend may be coming to an end.
Now, it is pertinent I say how this indicator relates to volume. Remember I said earlier that it is a volume based indicator. At the accumulation phase, people will keep buying the asset. This phase is often know as a discount price in the market, when the price of an asset is very low. Traders therefore want to acquire the asset as the price is affordable, and so as many traders keep buying, the volume of the price will be rising. So, in essence, at the accommodation phase, there's increased or high volume since many traders hold the asset, and AD indicator is seen bullish. On the other hand, there will be a phase when the price of an asset has greatly increased. It is a stage when the price is overbought. It is often called premium price. And traders sell at this price. Then, traders at this phase can no longer hold the asset. Hence, they begin to distribute it. As soon as they begin distributing, the volume begin to decrease. Therefore, at distribution phase, there is reduced or low volume and the AD Indicator is seen bearish.
Question 2
Through some platforms, show the process of how to place the A/D Indicator (Screenshots needed).
For this question, I am going to use MT4 Platform. Let's see how to add A/D indicator to the chart.
- Firstly, locate the app, Mt4 app on your phone and then click on it.
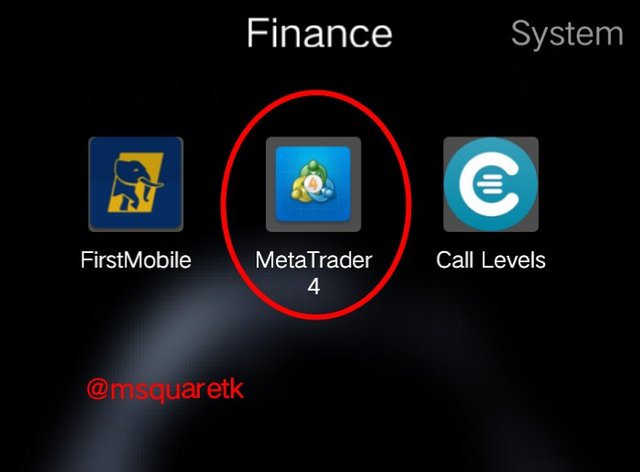
Fig. 4: Mt4 App on my Phone | My Gionee S11 lite
- Then, the next thing is that, the app will open. You will see various cryptocurrencies pair if you have a list or demo account with a crypto broker. If you don't have, then you will need to register with one.
Fig. 5: Crypto Assets on Mt4 | Mt4 Platform
- Next is to select the cryptocurrency pair you want to add A/D indicator to. Click on the chart and on clicking it, some features will appear. Click on open chart
For me, I am going to choose BTCUSD pair.
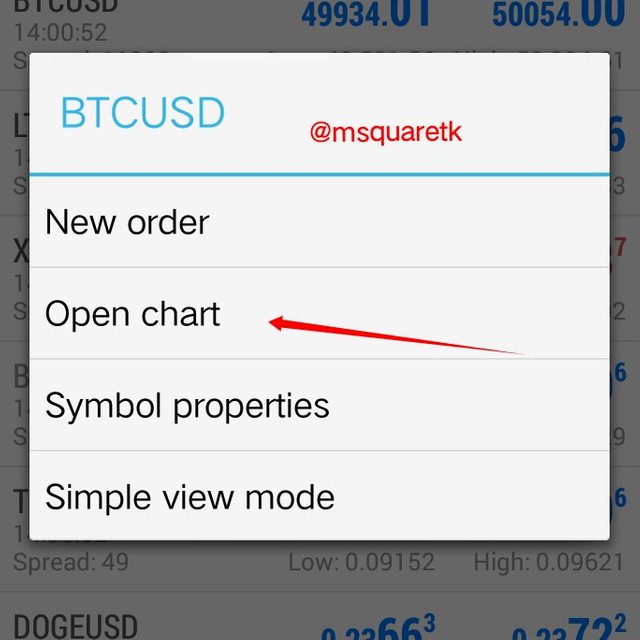
Fig. 6: Opening BTCUSD to Chart | Mt4 Platform
- Then once it opens, you will see some icon at the top of the chart. Click on icon like f. The icon is an indicator icon. It is circled in the screenshot below and a yellow arrow point at it, too.
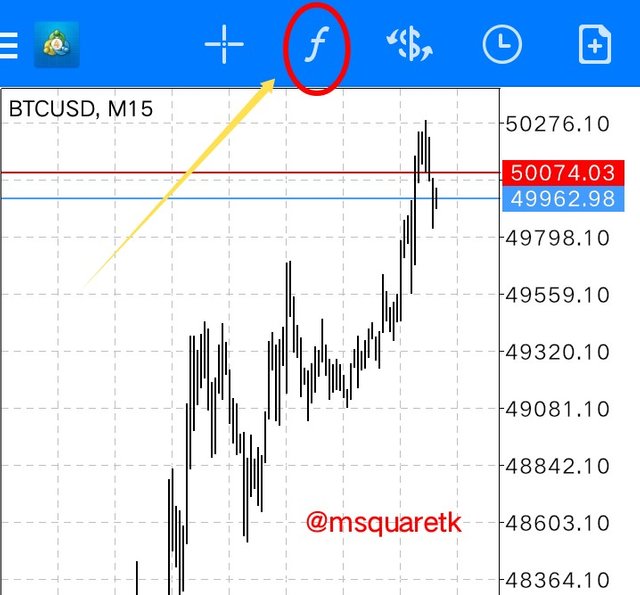
Fig. 7: BTCUSD Chart showing Indicator icon | Mt4 Platorm
- Then, upon clicking on it, you will be taken to the indicator page. Scroll down to where volume based indicators are. Click on accumulation/distribution. It is boxed with a red rectangle in the screenshot below.
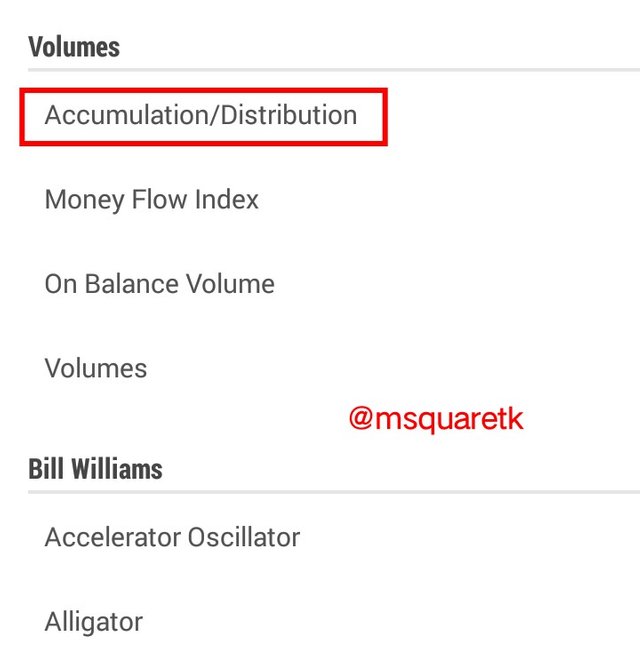
Fig. 8: Volume Based Indicators – Accumulation/Distribution | Mt4 Platorm
- Upon clicking on accumulation/distribution indicator, you will be taken to where you can configure it. You can change the color, the pixel (the thickness of the line).
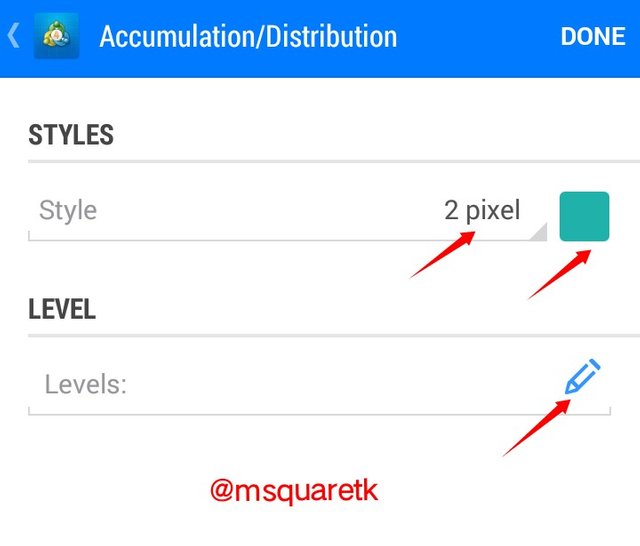
Fig. 9: Configuration Page of A/D indicator | Mt4 Platorm
- Once you are satisfied with the configuration, click done at the top of the page. Then the indicator will be added to the chart.
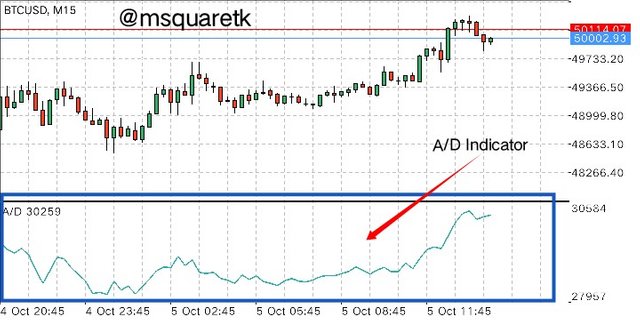
Fig. 10: A/D indicator on the chart of BTCUSD | Mt4 Platorm
Question 3
Explain through an example the formula of the A/D Indicator. (Originality will be taken into account).
In this part of the question, I am going to be explaining the formula for A/D indicator with an example.
Now, to calculate AD, the formula actually has three parameters.
- Money flow multiplier
- Money flow volume
- Previous Accumulation/Distribution line.
The first thing to find is previous Accumulation and distribution. After that you look for the money flow multiplier and money flow volume. Then, the product of money flow multiplier and money flow volume is then added to the previous accumulation and distribution.
Hence,
AD = P (AD) + MFM × MFV
Where AD = Accumulation/Distribution
P(AD) = Previous Accumulation/Distribution
MFM = Money Flow multiplier
MFV = Money Flow volume.
Now, to calculate Money flow multiplier (MFM):
MFM = [(C - L) - (H- C)] / (H- L)
Where C = closing price
L= Low of of the price
H = High of the price
To calculate the Money flow volume (MFV):
Money flow volume is the product of money flow multiplier and volume of the period.
MFV = MFM × VP
VP = Volume of the period
Now, let's calculate this with an example.
I am going to use the chart of DOGEUSD to take parameters for the calculation.
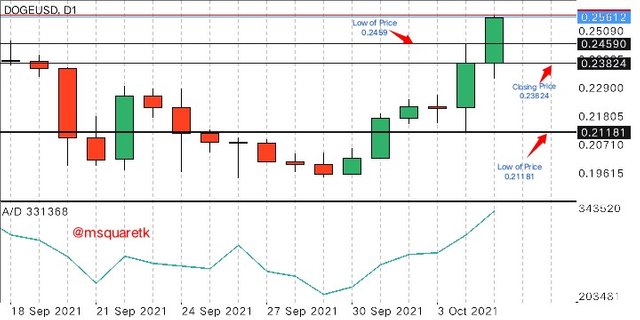
Fig. 11: Close, High and Low of price of the daily candle on DOGEUSD | Mt4 Platorm
Now, from the screenshot, we are going to take the data of the daily candle that formed. We will yake the close, high and low of the candle.
- Closing price = 0.23824
- High of the price = 0.24590
- Low of the price = 0.21181
Also, we need the value for the previous AD line and the volume of the period. Let's take it from the same chart.
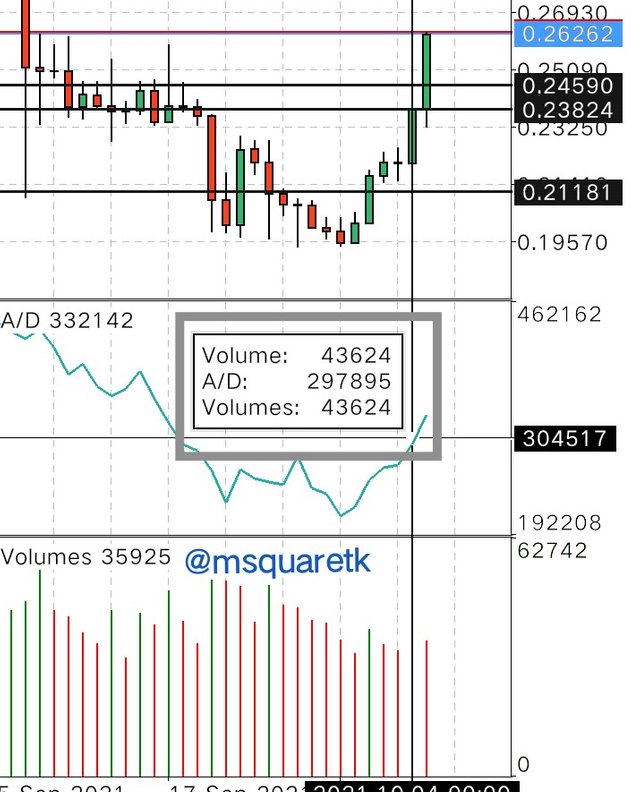
Fig. 12: Value of Volume and Previous AD | Mt4 Platorm
Form the screenshot:
- the value of volume of the period = 43624
- previous AD line = 297895
Now, let's use the parameters for the calculation of AD.
Remember that:
AD = P (AD) + MFM × MFV
Now, let's calculate money flow multiplier MFM first.
MFM = [(C - L) - (H- C)] / (H- L)
- Closing price (C) = $0.23824
- High of the price (H) = $0.24590
- Low of the price (L) = $0.21181
MFM = [(0.23824 – 0.21181) – (0.24590 – 0.23824)] / (0.24590 – 0.21181)
MFM = [ 0.02643 – 0.00766] / 0.03409
MFM = 0.01877 / 0.03409
MFM = 0.55060
Therefore, Money flow multiplier (MFM) = 0.55060
Now, let's calculate money flow volume (MFV)
MFV = MFM × VP
VP = volume of the period = 43624 (data taken from the chart)
MFV = 0.55060 × 43624
MFV = 24019.433
Hence, Money flow volume = 24019.433
Now, the next thing is to substitute the value of MFM, MFV P(AD) into the formula.
Remember:
AD = P (AD) + MFM × MFV
P(AD) = previous accumulation and distribution = 297895
MFM = Money flow multiplier = 0.55060
MFV = Money flow volume = 24019.433
AD = 297895 + 0.55060 × 24019.433
AD = 297895 + 13225.0999
AD = 311120.0999
Therefore, AD = 311, 120.0999
Question 4
How is it possible to detect and confirm a trend through the A/D indicator? (Screenshots needed)
In this part of the question, I will be showing you how to detect and confirm the trend through the A/D indicator. We will be looking at how to know when the price of an asset is in an uptrend and when it is in a downtrend. Let's begin with an uptrend.
- For Uptrend
To determine or detect if a trend is bullish with the A/D indicator, the price must be seen ascending up, that moving up. Then, once the price is showing a series of higher highs and higher lows, the indicator, A/D indicator must also be going in the same direction. Then, that trend is said to be in an Uptrend. Let's see the screenshot below to understand what I'm talking about very well.
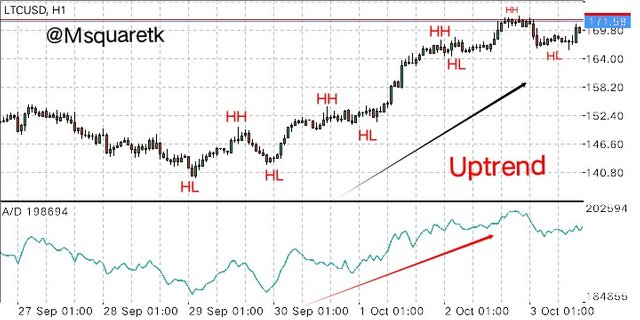
Fig. 13: Detection of Uptrend Using A/D indicator | Mt4 Platorm
You can clearly see in the screenshot above that the price is moving up, showing higher highs and higher lows. Also, if you look at the A/D indicator, you will notice, it's also following the same direction. It is going up with series of higher highs and higher lows.
- For Downtrend
A/D indicator can also be used to detect if an asset is in a downtrend. In this case, the price of an asset will be moving downward with series of lower lows and the A/D indicator will also be declining. Once the direction of the price and that of the A/D indicator is towards the downside, then the asset is said to be in a downtrend or bearish.
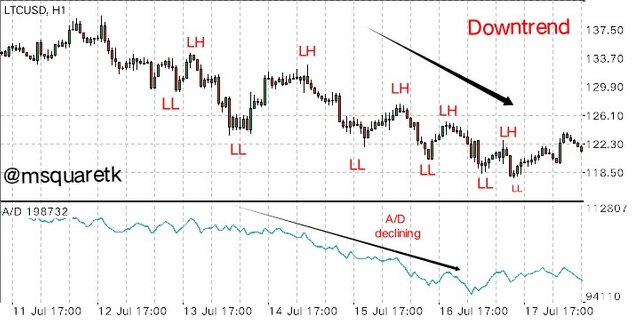
Fig. 13: Detection of Downtrend Using A/D indicator | Mt4 Platorm
As it is seen in the screenshot above, the price was declining and Al the indicator is also declining. This shows that the trend at that particular period of time is bearish.
Question 5
Through a DEMO account, perform one trading operation (BUY or SELL) using the A/D Indicator only. (Screenshots needed).
Now, in this part of the question, I will be demonstrating my understanding of the A/D indicator strategy taught by our Professor @allbert.
I'm going to place a sell trade. I will be using the chart of XPRUSD for the trade.
Looking at the chart of XPRUSD, I noticed that the asset is in an uptrend. Having known that, if i will place a sell trade with the strategy, the asset must be in an uptrend and divergence must occur signifying exhaustion in the current trend.
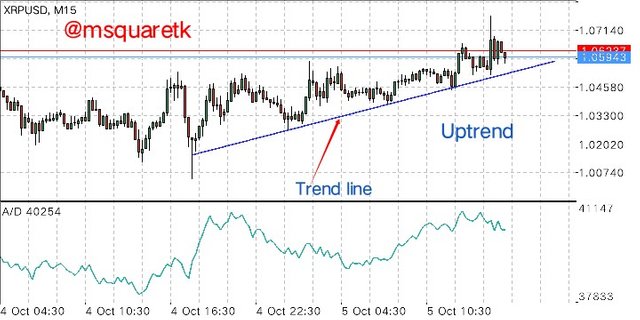
Fig. 14: The chart of XPRUSD in an Uptrend | Mt4 Platorm
So, spotting the chart above, I drew trend line and was waiting for the trend line to break.
So, minutes later, the trend line broke. Then, for the Strategy to be effective
- Price should be in an uptrend (if you want to sell) with series of higher highs and higher lows.
- Divergence must occur. Divergence means that price is making higher highs while A/D indicator is making lower highs.
- Then, there must be a break below the trendline.
So, if all is met, you are good to go. In my case, price has broken the trend line. Let's see the screenshot below.
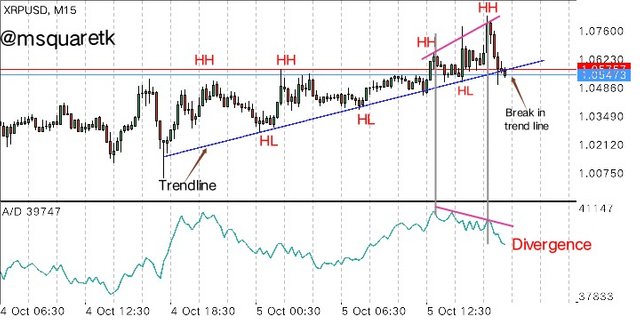
Fig. 15: Analysis to place a sell trade on the chart of XPRUSD | Mt4 Platorm
Now, since the criteria is met, I can place a sell trade. Immediately the candle that broke the the trend lime finished forming, I placed a sell trade with stop loss at the current high and take profit at level to have 1:1 risk reward ratio.
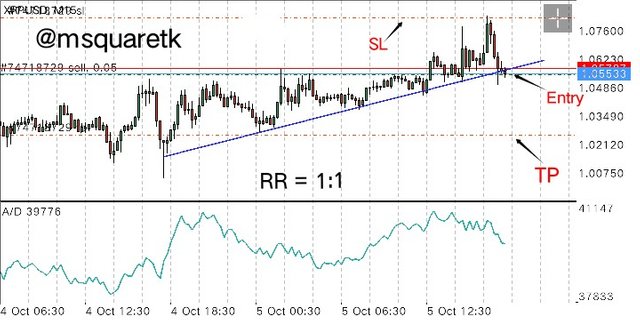
Fig. 16: Sell trade with Entry, Stop loss and take profit on the chart of XPRUSD | Mt4 Platorm
Below is the screenshot showing the trade running. I will keep monitoring and updating you about the progress as time goes on.
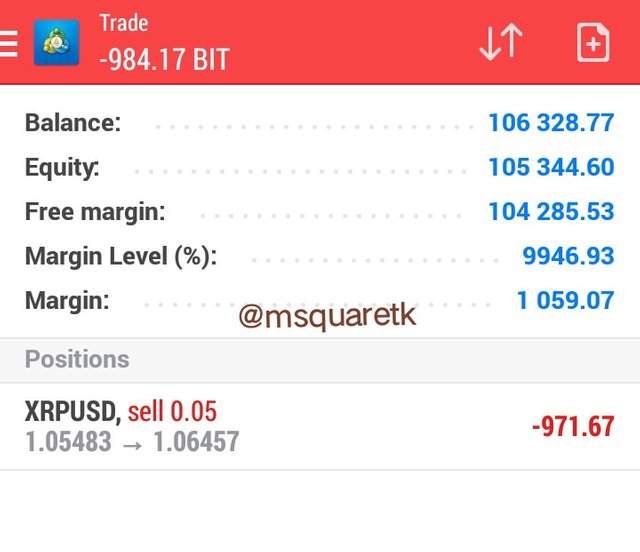
Fig. 17: Sell trade running | Mt4 Platorm
Question 6
What other indicator can be used in conjunction with the A/D Indicator. Justify, explain and test. (Screenshots needed.
In this part of the question, I will be using an indicator known as Relative strength index (RSI).
Relative Strength index is an oscillator based indicator that measures the strength of price. RSI shows when the price of an asset is overbought and oversold. It has a scale of 0 – 100. The scale of 0 – 30 represents the oversold region. The scale of 70 – 100 represents the overbought region. When the price crosses 70 and moves upward, it means the price of an asset is overpriced. When the price of an asset crosses 30 and moves below, it means the price is oversold.
It consists of a line that oscillates up and down its window scale.
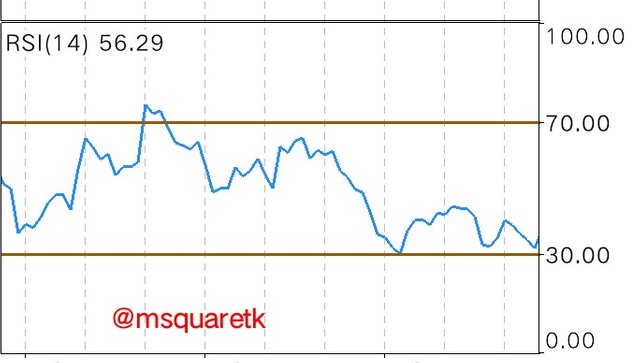
Fig. 18: RSI Indicator | Mt4 Platorm
RSI also shows divergence. This occurs when the indicator, RSI moves in a direction contrary to the direction of price.
Combining RSI and AD Indicator will then help to filter false signal and help us predict more accurately since RSI even shows when the price is overbought and oversold.
Now, let's see the screenshot below.
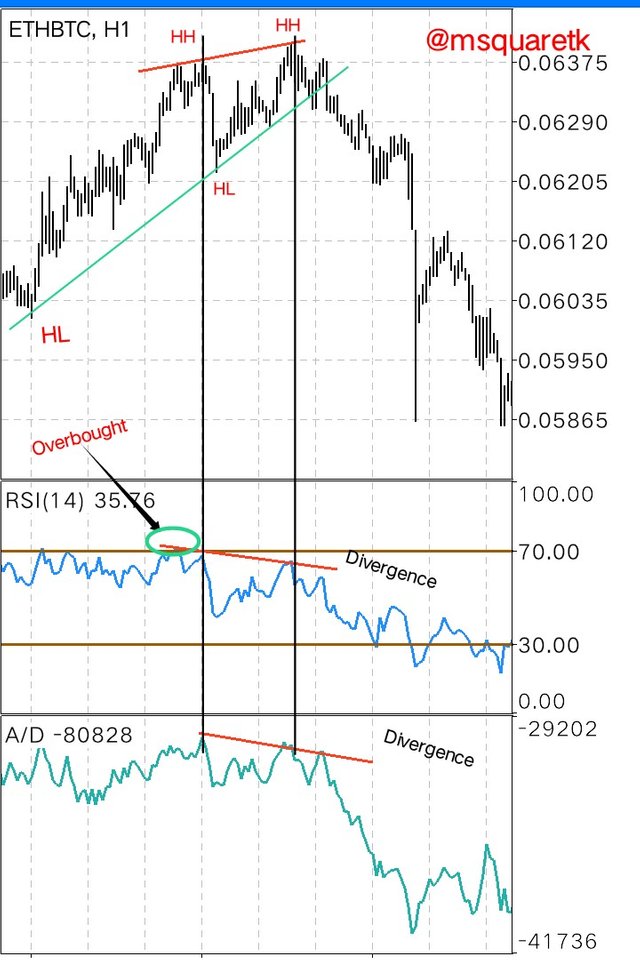
Fig. 19: RSI and AD Indicator on the Chart Confirming the reversal | Mt4 Platorm
In the screenshot above, I have added RSI and AD inducator to the chart. As it is seen in the screenshot, price of an asset was in an uptrend. And we know that to catch the reversal on the AD Indicator, divergence must occur and the trend line must break. And which is what had happened to the AD indicator. To further confirm if the signal is valid, RSI also shows that the price of the asset was overbought. Seeing that the price entered overbought is a signal that the buyers are exhausted and that the trend may change. Shortly after the overbought there was a divergence. There is now double confirmation from the RSI, overbought and divergence and there's a signal for sell from AD indicator and trend line break, too.
From the screenshot above, we can see that the signals from RSI and AD inducator confirmed the sell. And the price rally downside.
Now, I am going to place a demo trade using the two indicators, RSI and AD.
Now, we know that to use AD to place a sell trade, price must be I an uptrend and that the divergence must occurs, that is price rising and the AD falling. On the chart of LTCUSD below, the price is rising while the AD is declining, which signifies divergence. Also, RSI enter overbought and as soon as that happens, divergence follows which has given me double confirmation. Then, the was a breakout in the trend line.
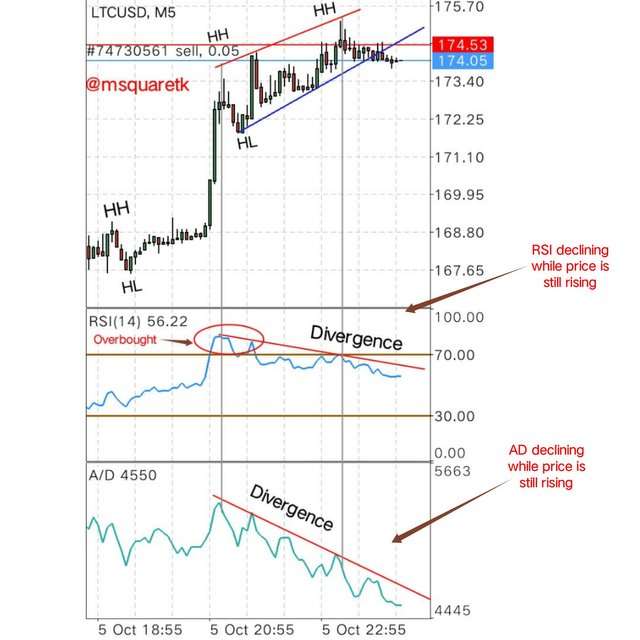
Fig. 20: Using RSI and AD indicator to place a Sell trade on the chart of LTCUSD | Mt4 Platorm
Since all criteria were met, got a signal from AD and also from RSI and trendline broke. Then I placed an instant sell execution with stop loss at the current high and take profit was at a level to have a risk reward ratio of 1:2.
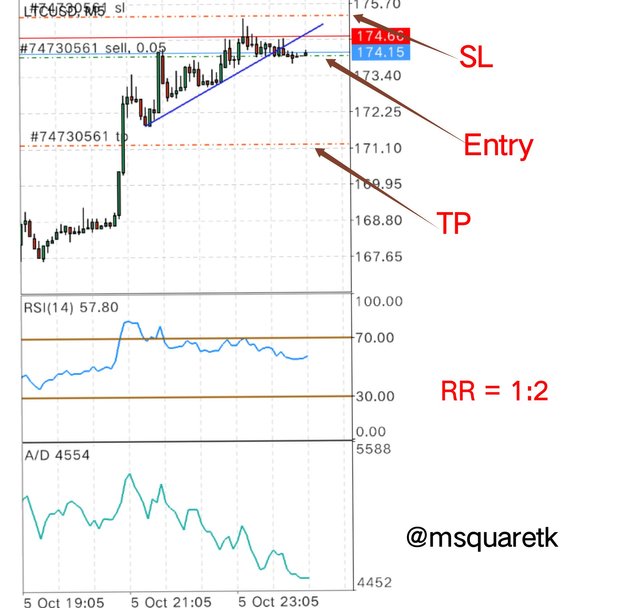
Fig. 21: Entry, Stop loss and take profit of the sell order on LTCUSD | Mt4 Platorm
Below is the trade running immediately I placed it.
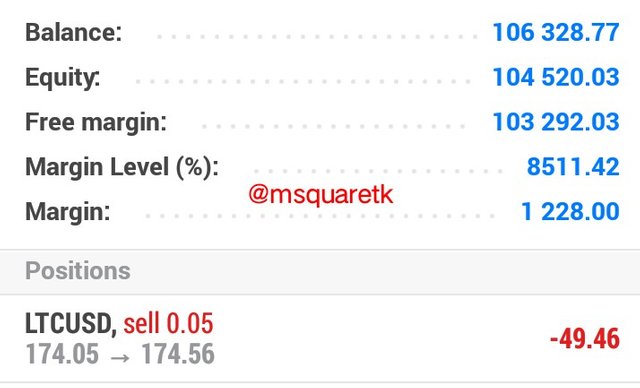
Fig. 22: LTCUSD sell order running | Mt4 Platorm
Conclusion
AD inducator is an indicator which is used by traders to determine the accumulation and distribution phase of an asset. The indicator shows when the money is flowing in and out of an asset. AD indicator uses the price and volume, hence it is often referred to as volume-based indicator.
Like all other indicators, AD doesn't always give accurate signal. It should therefore pertinent to know that the traders should not use it as a standalone tool. Other technical tools such as candlestick patterns, chart patterns, fibonacci tools, other technical indicators etc. can be combined with AD Indicator in order to have effective and valid signals.
Thanks to Professor @allbert for bringing this course up. I have learnt one or two things from the course. I have also learned to combine another indicator, RSI with AD indicator. I look forward to seeing your next course.
CC : @allbert
Written by me, @msquaretk