BTCUSD Analysis 05-03-2020
Green Line: 21MA (Dynamic Support and Resistance)
Time Frame: Daily and H4
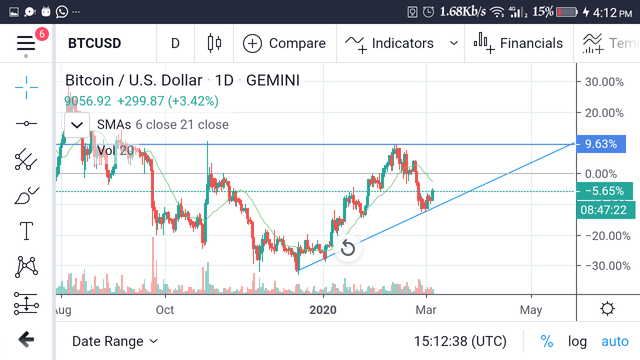
Today my analysis on the BTCUSD would be majorly on the Daily Time Frame and I'd try to bring updates as the real intention of the BTC price unfolds.
As my chart shows, the BTC price has been trapped in an ascending triangle which means the best place the price can go from there is up.
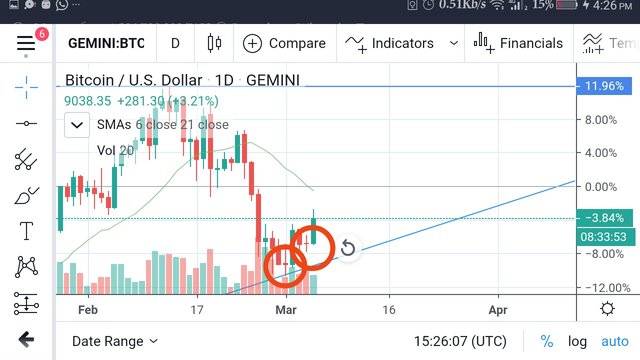
From the above picture, we can see that the bullish reversal candlestick pattern called Morning Star has formed twice which mostly means a bullish run. But the dynamic resistance might just reject the price to the trendline before a bullish continuation.
Let's zoom into the 4hr Time Frame
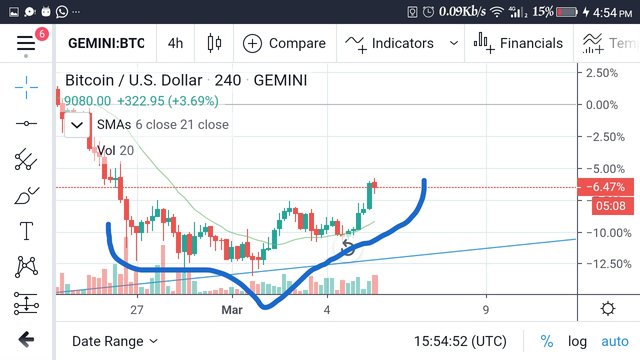
The overall chart pattern on the 4hr time frame is what is called the Inverse head and shoulder which is another confirmation of a bullish move.
Also, I wouldn't pay attention to the spinning top forming currently on the 4hr as the candle is still new and might eventually close as a bullish candlestick.
Till I write again,
Pearlumie.
This is not a FINANCIAL ADVICE. I’m not in anyway responsible for any losses you might incur trading Cryptocurrencies
I also shared to Twitter
https://twitter.com/Pearlumie/status/1235611985347334144?s=19
According to the Bible, The Story of Gideon: On Making Choices and the Second Coming.
Watch the Video below to know the Answer...
(Sorry for sending this comment. We are not looking for our self profit, our intentions is to preach the words of God in any means possible.)
Comment what you understand of our Youtube Video to receive our full votes. We have 30,000 #SteemPower. It's our little way to Thank you, our beloved friend.
Check our Discord Chat
Join our Official Community: https://steemit.com/created/hive-182074