RELATIVE STRENGTH INDEX (RSI)
INTRODUCTION
Developed by J. Welles Wilder, the Relative Strength Index (RSI) is a momentum oscillator that measures the speed and change of price movements. RSI oscillates between zero and 100. Traditionally, and according to Wilder, RSI is considered overbought when above 70 and oversold when below 30. Signals can also be generated by looking for divergences, failure swings, and centerline crossovers. RSI can also be used to identify the general trend.
RSI is an extremely popular momentum indicator that has been featured in a number of articles, interviews, and books over the years. In particular, Constance Brown's book, Technical Analysis for the Trading Professional, features the concept of bull market and bear market ranges for RSI. Andrew Cardwell, Brown's RSI mentor, introduced positive and negative reversals for RSI. In addition, Cardwell turned the notion of divergence, literally and figuratively, on its head.
Wilder features RSI in his 1978 book, New Concepts in Technical Trading Systems. This book also includes the Parabolic SAR, Average True Range and the Directional Movement Concept (ADX). Despite being developed before the computer age, Wilder's indicators have stood the test of time and remain extremely popular.
CALCULATION
100
RSI= 100- -------
1+RS
RS= AVERAGE GAIN OR AVERAGE LOSS
To simplify the calculation explanation, RSI has been broken down into its basic components: RS, Average Gain and Average Loss. This RSI calculation is based on 14 periods, which is the default suggested by Wilder in his book. Losses are expressed as positive values, not negative values.
The very first calculations for average gain and average loss are simple 14-period averages.
First Average Gain = Sum of Gains over the past 14 periods / 14.
First Average Loss = Sum of Losses over the past 14 periods / 14
The second, and subsequent, calculations are based on the prior averages and the current gain loss:
Average Gain = [(previous Average Gain) x 13 + current Gain] / 14.
Average Loss = [(previous Average Loss) x 13 + current Loss] / 14.
Taking the prior value plus the current value is a smoothing technique similar to that used in calculating an exponential moving average. This also means that RSI values become more accurate as the calculation period extends. SharpCharts uses at least 250 data points prior to the starting date of any chart (assuming that much data exists) when calculating its RSI values. To exactly replicate our RSI numbers, a formula will need at least 250 data points.
Wilder's formula normalizes RS and turns it into an oscillator that fluctuates between zero and 100. In fact, a plot of RS looks exactly the same as a plot of RSI. The normalization step makes it easier to identify extremes because RSI is range bound. RSI is 0 when the Average Gain equals zero. Assuming a 14-period RSI, a zero RSI value means prices moved lower all 14 periods. There were no gains to measure. RSI is 100 when the Average Loss equals zero. This means prices moved higher all 14 periods. There were no losses to measure.
PARAMETERS
The default look-back period for RSI is 14, but this can be lowered to increase sensitivity or raised to decrease sensitivity. 10-day RSI is more likely to reach overbought or oversold levels than 20-day RSI. The look-back parameters also depend on a security's volatility. 14-day RSI for internet retailer Amazon (AMZN) is more likely to become overbought or oversold than 14-day RSI for Duke Energy (DUK), a utility.
RSI is considered overbought when above 70 and oversold when below 30. These traditional levels can also be adjusted to better fit the security or analytical requirements. Raising overbought to 80 or lowering oversold to 20 will reduce the number of overbought/oversold readings. Short-term traders sometimes use 2-period RSI to look for overbought readings above 80 and oversold readings below 20.
OVERBOUGHT-OVERSOLD
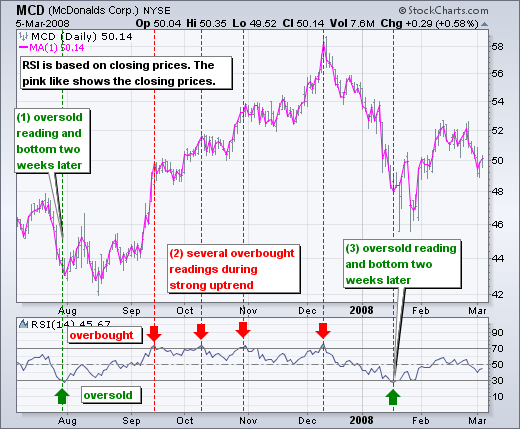
Wilder considered RSI overbought above 70 and oversold below 30. Chart 3 shows McDonalds with 14-day RSI. This chart features daily bars in gray with a 1-day SMA in pink to highlight closing prices because RSI is based on closing prices. Working from left to right, the stock became oversold in late July and found support around 44 (1). Notice that the bottom evolved after the oversold reading. The stock did not bottom as soon as the oversold reading appeared. Bottoming can be a process. From oversold levels, RSI moved above 70 in mid September to become overbought. Despite this overbought reading, the stock did not decline. Instead, the stock stalled for a couple weeks and then continued higher. Three more overbought readings occurred before the stock finally peaked in December (2). Momentum oscillators can become overbought (oversold) and remain so in a strong up (down) trend. The first three overbought readings foreshadowed consolidations. The fourth coincided with a significant peak. RSI then moved from overbought to oversold in January. The final bottom did not coincide with the initial oversold reading as the stock ultimately bottomed a few weeks later around 46 (3).
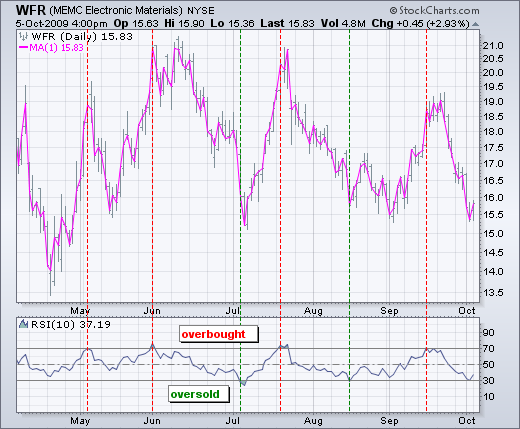
Like many momentum oscillators, overbought and oversold readings for RSI work best when prices move sideways within a range. Chart 4 shows MEMC Electronics (WFR) trading between 13.5 and 21 from April to September 2009. The stock peaked soon after RSI reached 70 and bottomed soon after the stock reached 30.
DIVERGENCE:-
According to Wilder, divergences signal a potential reversal point because directional momentum does not confirm price. A bullish divergence occurs when the underlying security makes a lower low and RSI forms a higher low. RSI does not confirm the lower low and this shows strengthening momentum. A bearish divergence forms when the security records a higher high and RSI forms a lower high. RSI does not confirm the new high and this shows weakening momentum. Chart 5 shows Ebay (EBAY) with a bearish divergence in August-October. The stock moved to new highs in September-October, but RSI formed lower highs for the bearish divergence. The subsequent breakdown in mid October confirmed weakening momentum.
.png)
A bullish divergence formed in January-March. The bullish divergence formed with eBay moving to new lows in March and RSI holding above its prior low. RSI reflected less downside momentum during the February-March decline. The mid-March breakout confirmed improving momentum. Divergences tend to be more robust when they form after an overbought or oversold reading.
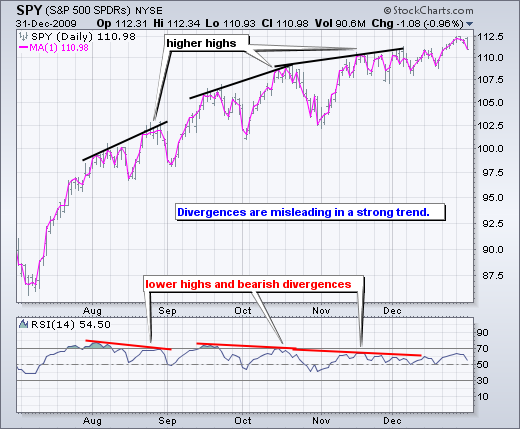
Before getting too excited about divergences as great trading signals, it must be noted that divergences are misleading in a strong trend. A strong uptrend can show numerous bearish divergences before a top actually materializes. Conversely, bullish divergences can appear in a strong downtrend - and yet the downtrend continues. Chart 6 shows the S&P 500 ETF (SPY) with three bearish divergences and a continuing uptrend. These bearish divergences may have warned of a short-term pullback, but there was clearly no major trend reversal.
FAILURE SWING:-
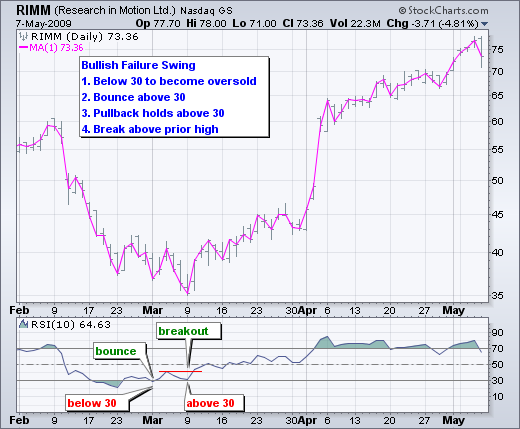
Wilder also considered failure swings as strong indications of an impending reversal. Failure swings are independent of price action. In other words, failure swings focus solely on RSI for signals and ignore the concept of divergences. A bullish failure swing forms when RSI moves below 30 (oversold), bounces above 30, pulls back, holds above 30 and then breaks its prior high. It is basically a move to oversold levels and then a higher low above oversold levels. Chart 7 shows Research in Motion (RIMM) with 10-day RSI forming a bullish failure swing.
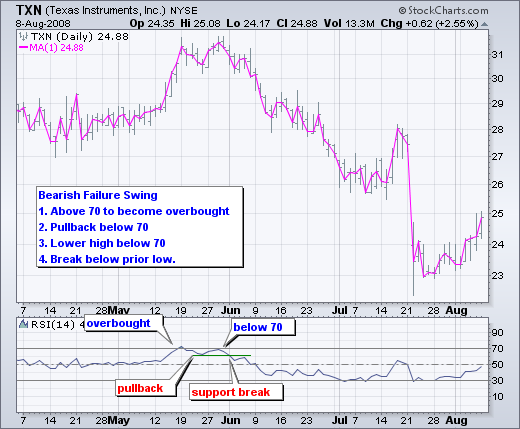
A bearish failure swing forms when RSI moves above 70, pulls back, bounces, fails to exceed 70 and then breaks its prior low. It is basically a move to overbought levels and then a lower high below overbought levels. Chart 8 shows Texas Instruments (TXN) with a bearish failure swing in May-June 2008.