📈 True Profitable Cryptocurrency Trading 💰 - [RESEARCH PT 8.]

Man this research is definitely taking longer than expected, but I am making good progress so I guess I can spare my spare time for this. Although I would like to finish it, every time I find more interesting stuff out there.
In this article I want to talk about the Exponential Moving average, and how to use it properly, and what features I have found out about it.
I have talked in the past about the EMA, but mostly negatively, although further research proves that it’s not that bad, actually if you don’t have any other tool in your trading software or such, then definitely sticking to the EMA is not bad.
However people were using the EMA incorrectly, let me show you how to use it properly.
The EMA
So the EMA as any other moving average, is trying to estimate the mean of the probability distribution of the price. Since it’s heteroskedastic, the distribution will have a “moving mean” or a “transitioning mean” rather.
This means that the mean is not the same. With a coin toss, it’s always 0.5 since it’s a static event. The market is not static, it’s a moving time series, so the mean will transition as well.
If the market were efficient, then forecasting it would be impossible. But it’s not. There is always a little bit of inefficiency there, just enough to exploit it with the proper tools.
If the market were efficient, then the best forecast for the next datapoint would be the last datapoint.
However since it’s not efficient, thus incorporating several previous values into the forecast equation is essential, it gives us more information, since the past datapoints carry potential future information with them.
So the mean will definitely not be an average with equal weights, like the arithmetic average, we will have to assign weights to each LAG according to their importance in the equation.
Obviously the latest lag will bear the most weight, and slowly or quickly decay afterwards into insignificance as we scoop in the past for information.
How to assign the Weights?
This is the only question that matters. Now I won’t reveal here the exact methods how to use them, obviously the model can be more complex. But just as a basic overview to market newbies to guide them towards better accuracy when forecasting the markets.
Most of you have been using the EMA weights totally wrong. In most trading softwares the EMA is defined like this:
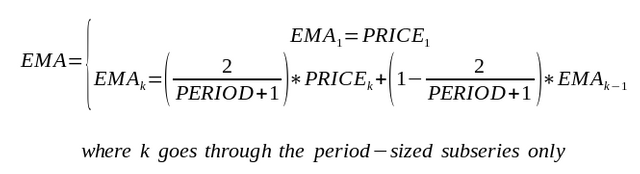
So the variable is traditionally called “alpha” and it ranges between 0 and 1, where zero means no EMA and 1 means no weight on the previous values, essentially a random walk model.
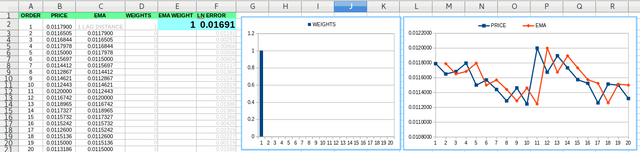
If we set the the alpha to different values we can see how the weights and the EMA changes:
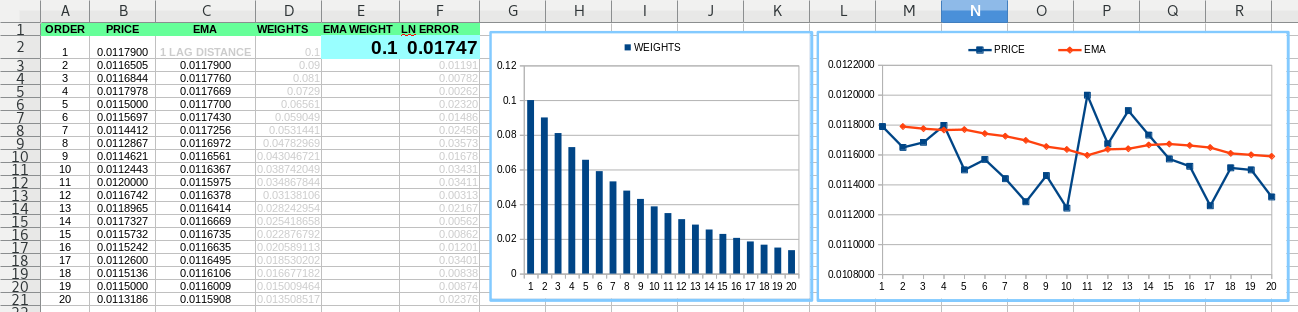
Alpha = 0.1
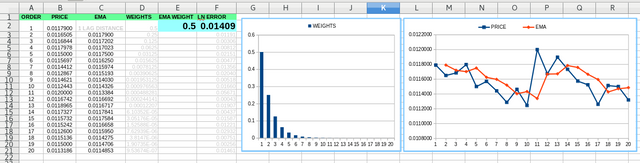
Alpha = 0.5
Alpha = 0.9
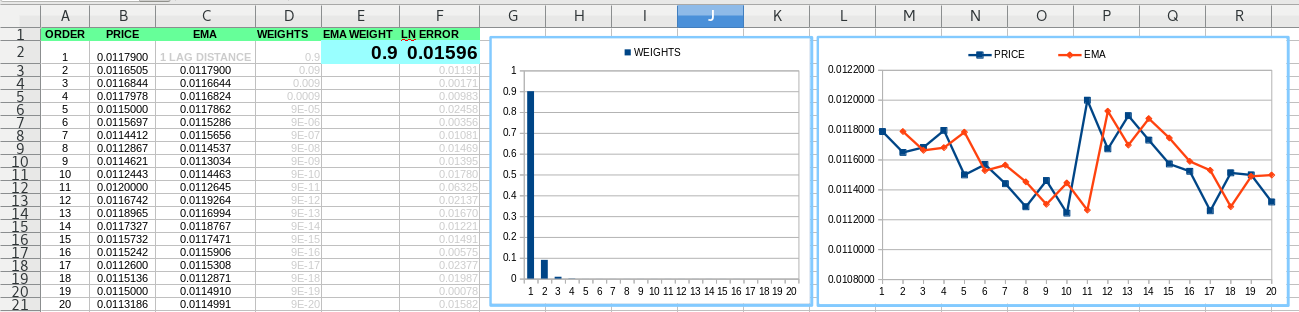
As you can see the higher the alpha the more emphasis on the previous value, the less emphasis on the ones earlier, decaying quite quickly.
If the Alpha = 1 then only the previous value is taken. This signals a random walk, as this information is useless from a forecasting standpoint, we don’t learn anything from this model.
Which Alpha is optimal?
Well if the model sucks, then the value of 1 will always give the biggest results. In the snippet above, the 0.5 value seem to give the lowest error. However on larger samples and simulations, the correct value will always converge towards between 0.9 and 1.
On a trading software this is impossible to set. Since the trading software will follow the 2/(PERIOD+1) formula, even if you choose a PERIOD 2 based EMA that will be an alpha of 0.66.
And of course a PERIOD 1 will be 1, and that is not good.
You literally can’t choose a 0.9 for Alpha on most trading softwares, yet all evidence points towards the optimal values ranging in those ranges.
It’s almost like a conspiracy, that the brokers and software makers who design those tools don’t want you to have accurate tools. Interesting isn’t it?
No wonder they put all kinds of crappy useless Technical Analysis tools that don’t really work.
How to use the EMA?
Again, you were probably been using it wrongly. It’s not meant to be used as crossovers, it’s just a forecasting tool. The Nth EMA is the N+1 Price, if it’s configured well, then it should give an accurate forecast for the N+1 Price datapoint.
Again, it’s not just as simple as a basic EMA, there can be other elements added to it, like a volatility estimator like a GARCH or an error correcting term.
More sophisticated quantitative tools give better results, since it factors in other properties of the price.
But with just a basic EMA alone set between 0.9 and 1.0 the forecasting accuracy will increase massively.
The Alpha of course has to be estimated at every new datapoint, or using an adaptive estimator to make it “autopilot”.
Conclusion
So it looks like I will be using the EMA as well, or at least a variant of it. It is definitely useful as a forecasting tool, but it’s just a basic one. There are much more advanced tools out there, with much better accuracy.
Disclaimer: The information provided on this page or blog post might be incorrect, inaccurate or incomplete. I am not responsible if you lose money or other valuables using the information on this page or blog post! This page or blog post is not an investment advice, just my opinion and analysis for educational or entertainment purposes.
Sources:
https://pixabay.com
https://www.pexels.com

great trading.
Posts like these are a lot to take in, but can be very useful for someone trying to learn about playing the market. Good work - this looks like it took a lot of time to write up.
It takes a lot more time to research it than to write this. I think my audience is sort of experienced with trading, so these articles about my research are not necessarily for complete newbies. I wrote articles for newbies in the past.