KABOOM!! Alphabet (GOOG) Rises 8.5% Since @haejin's Analysis on April 25

SUMMARY
Note: For anyone who missed the BitcoinLive Information Webinar, here is the replay link: https://www.youtube.com/watch?v=32l40SNYOp4
As of June 4, ALL Crypto Analysis will be posted on the BitcoinLive channel and Steemit will be dedicated for Equity, Commodity and Options Analysis. To Signup for the BitcoinLive limited Founding Membership slots, use this link: https://get.bitcoin.live/haejin/
__
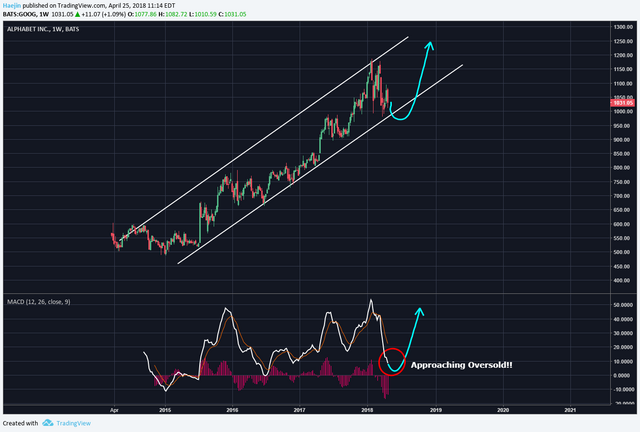
Back on April 25, I had posted the below analysis of Alphabet (GOOG). Price had been moving in a channel since its genesis and that it wasn't likely for that to change in the short term. The MACD was also approaching oversold conditions. The projection was that price would turn up as shown by the blue arrow.
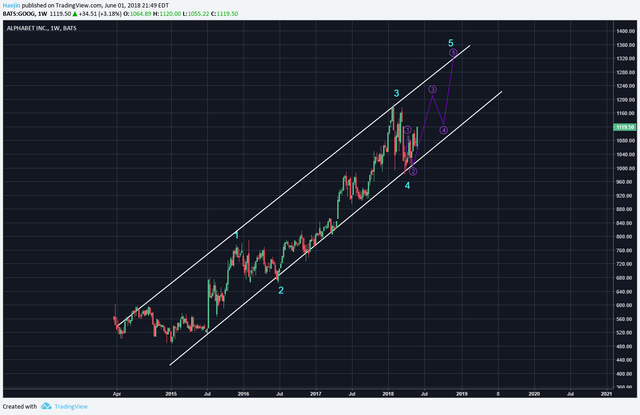
Since then, price has climbed 8.5% and for equities, that is a huge gain in such a short time frame of just over a month. I've also added the Elliott Waves. The blue wave 5 could be in progress and the purple waves are its subwaves. This means that higher highs are likely.
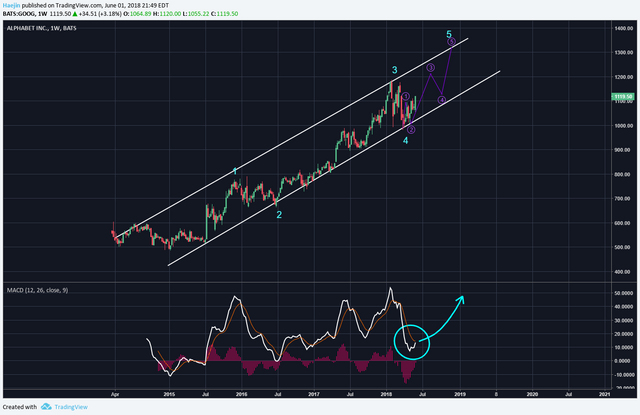
The MACD is curling up and soon a buy signal should be triggered (blue circle) and rise to support the impulse subwaves of blue 5.
Legal Disclaimer: I am not a financial advisor nor is any content in this article presented as financial advice. The information provided in this blog post and any other posts that I make and any accompanying material is for informational purposes only. It should not be considered financial or investment advice of any kind. One should consult with a financial or investment professional to determine what may be best for your individual needs. Plain English: This is only my opinion, make of it what you wish. What does this mean? It means it's not advice nor recommendation to either buy or sell anything! It's only meant for use as informative or entertainment purposes.
Please consider reviewing these Tutorials on:
Elliott Wave Counting Tutorial #1
Elliott Wave Counting Tutorial #2
Elliott Wave Counting Tutorial #3
Laddering and Buy/Sell Setups.
Laddering Example with EOS
Tutorial on the use of Fibonacci & Elliott Waves
@haejin's Trading Nuggets
Essay: Is Technical Analysis a Quantum Event?
Follow me on Twitter for Real Time Alerts!!
Follow me on StockTwits for UpDates!!
--
--


This is also cool.
Nice projection.
Well done .
May this rise continue