Dover Corp. (DOV): Time to be Cautious?

SUMMARY
Note: For anyone who missed the BitcoinLive Information Webinar, here is the replay link: https://www.youtube.com/watch?v=32l40SNYOp4
As of June 4, ALL Crypto Analysis will be posted on the BitcoinLive channel and Steemit will be dedicated for Equity, Commodity and Options Analysis. To Signup for the BitcoinLive limited Founding Membership slots, use this link: https://get.bitcoin.live/haejin/
__
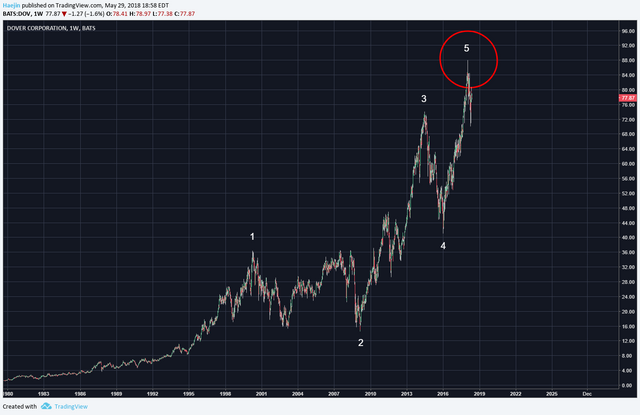
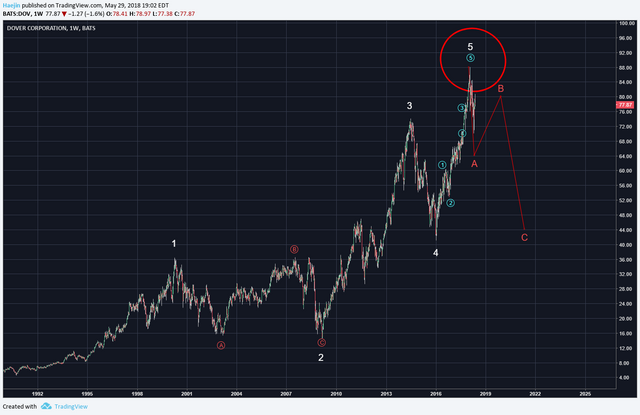
The below weekly chart of Dover Corporation (DOV) shows an impulse sequence that is probably complete. Wave 5 ended in a bit of a price wick which often is the way the last remaining buyers flame out (red circle). IF wave 5 is complete, then a requisite correction is likely to proceed. There is an alternate count for one more higher high; but it would only delay the coming correction.
The subwaves of white wave 2 was a classic abc. The subwaves of white wave 5 also qualifies the wave count. Red wave A of the ABC correction is also likely almost complete, if not already. The B wave bounce could lull many back into the stock but only later to be shocked by the remaining C wave down. Bear in mind that the correction is for a higher degree of trend wave 2 where the ABC are its subwaves. Wave 2 an retrace far more than where the current C is positioned.
Legal Disclaimer: I am not a financial advisor nor is any content in this article presented as financial advice. The information provided in this blog post and any other posts that I make and any accompanying material is for informational purposes only. It should not be considered financial or investment advice of any kind. One should consult with a financial or investment professional to determine what may be best for your individual needs. Plain English: This is only my opinion, make of it what you wish. What does this mean? It means it's not advice nor recommendation to either buy or sell anything! It's only meant for use as informative or entertainment purposes.
Please consider reviewing these Tutorials on:
Elliott Wave Counting Tutorial #1
Elliott Wave Counting Tutorial #2
Elliott Wave Counting Tutorial #3
Laddering and Buy/Sell Setups.
Laddering Example with EOS
Tutorial on the use of Fibonacci & Elliott Waves
@haejin's Trading Nuggets
Essay: Is Technical Analysis a Quantum Event?
Follow me on Twitter for Real Time Alerts!!
Follow me on StockTwits for UpDates!!
--
--


Thanks for the clarification .. and for this valuable information
best information....