Inverse head and shoulders today on NASDAQ:NEON
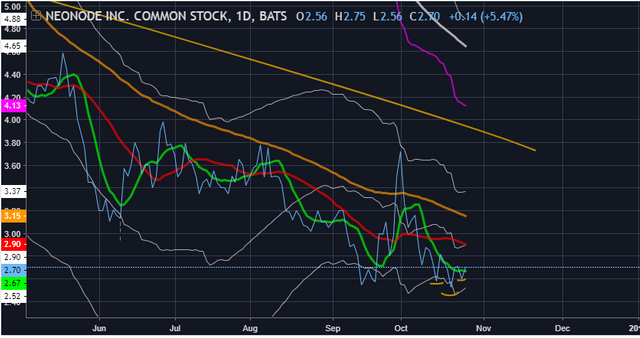
Here we see an inverse head and shoulders on neonode
https://www.tradingview.com/chart/NEON/0i65rYP0-Neonode-inverse-h-s-on-daily/
Zoomed out like this, we can see after the 10:1 Reverse split neonode/SBE chart reflects price per share now as 32,187 ATH -0.98% June 5th 2000
(Before the reverse split, ATH -0.98% was 3,218.70)
Usually this is a bullish signal to most traders but obviously take my signals with a grain of salt.