Bullish flag pattern - Identify and make profit
Hello Steemians!
Introduction
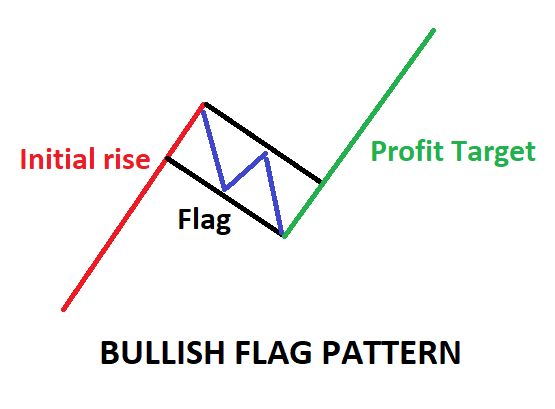
Flag pattern is a basic tool which is used to identify the points at which a breakout may occur. When the general trend of the price of any cryptocurrency is an uptrend, we may observe a Bullish flag pattern which is characterised by lower highs and lower lows.
This occurs because any currency cannot only go up. It has to retrace after a certain level of uptrend; consolidate, form support levels and then again make a move above.
The retracement of the cryptocurrency during its uptrend may form a flag pattern. When this pattern breaks above, we might take an entry into the market with proper targets and stop losses. This can be done in any time interval according to your convenience. Let’s discuss the strategy in detail.
Strategy
The basic strategy has following steps:
Step 1: Identify a flag pattern. When the flag pattern occurs during an uptrend, it is called as a bullish flag pattern and it may be a signal that the price will move up.
Step 2: The price breaks the flag and goes up. We take a position in the market at this point.
Step 3: The stop loss may be set at the lowest level of the flag.
Step 4: Profit can be taken at 10%, 15%, 20%, or maximum at the length of the pole of the flag.
Example
Let’s understand these steps with some examples:
Example 1:
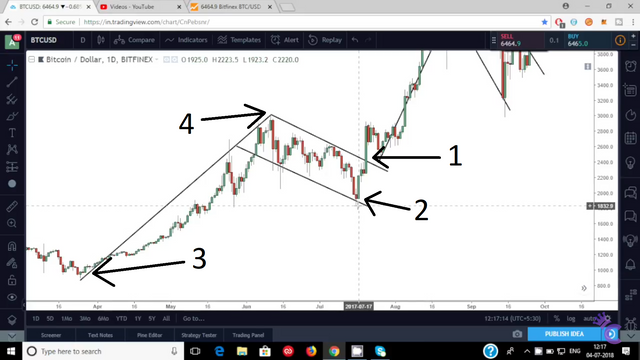
Step 1: The flag pattern is formed.
Step 2: We take at entry at point 1.
Step 3: The step loss is set at point 2.
Step 4: The profit can be taken at 10%, 15%, 20%. The maximum profit which you may expect safely is the difference between the prices at points 3 and 4.
That means the sell order can be set at = the price at point 1 + (difference of price between points 3 and 4). The difference of prices between points 3 and 4 is known as the length of pole of the flag.
Example 2:
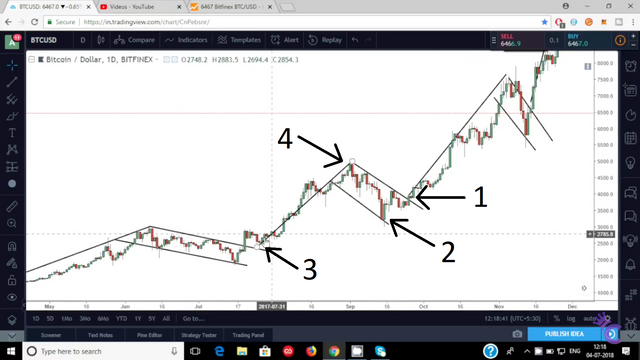
Step 1: The flag pattern is formed.
Step 2: We take at entry at point 1.
Step 3: The step loss is set at point 2.
Step 4: The profit can be taken at 10%, 15%, 20%. The maximum profit which you may expect safely is the difference between the prices at points 3 and 4.
That means the sell order can be set at = the price at point 1 + (difference of price between points 3 and 4)
I hope that I have explained the bullish flag pattern effectively. The topic is covered in more detail in our YouTube video on Bullish flag pattern.
If you have any queries on this pattern or any suggestions for me, do let me know. Stay active and stay safe in crypto trading.
Regards.
YouTube channel: Crypto King of India
Twitter handle: kingcryptoindia

How to identify and take benefit of Bearish flag pattern
Short selling – Explanation and example
How to use 18-day MA - Accurate guide
@swapnilgopal I gave you an upvote on your post! Please give me a upvote and I will give
you a follow in return and possible future votes!
You are done nice work. you are continuous work hard.
Thankyou @bhaveshsavani for saying this, do let me know if you have any suggestions for future blogs.
Nice post
Thankyou
Well explained
Thankyou @somasekhar
I think this Strategy can not work in short term
But I think it could work for log time trading
Yes you can use it on 12 hr or 1 day time frame @babarsunnygk
Awesome bro....thanks for this trick
Thankyou brother
InforMative post. Thanks
Thanks :)
Thank you for the simple and easy post https://9blz.com/bull-flag-pattern/