Killing Time With Recreational Math - Do The Great Lakes Have Tides?
The oceans have tides and I wrote a post about how that works in this post:
Hobbits and Tides - They Are Both Tricksy
So now that we know how the tides in the oceans work, the Great Lakes are very large, so it would only be natural to suppose that they themselves also have tides. Let's try to that find out.
THE GREAT LAKE WATER GAUGES
The Great Lakes from west to east are:
- Lake Superior (the largest and the most upstream lake),
- Lake Michigan (the American lake),
- Lake Huron,
- Lake Erie (the most shallow), and
- Lake Ontario (the downstream lake).
The Lakes have many weather and water level stations scattered along their shorelines that record data every 6 minutes and it is published online here. You can scroll through the list of stations and select whichever one seems interesting to you.
I chose the Duluth Minnesota station because it is on the largest of the Great Lakes (Lake Superior) and it is at the end of the lake so hopefully any effects will be magnified if the lake sloshes back and forth.
The graph below shows the water levels over the period from June 1 and into June 2. One can see that the water levels go up and down at regular intervals. This is promising.
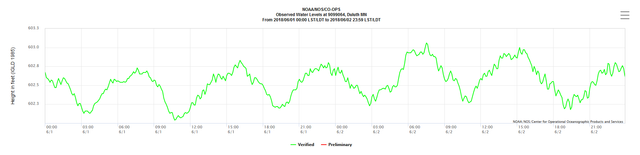
Public domain image.
Not only does the website plot out nice graphs but you can also download the data directly from the website and plot it yourself in Excel for analysis. I did this for a time period of several days in July 2018 (because it looked clean and not stormy) and plotted it as shown in the graph below.
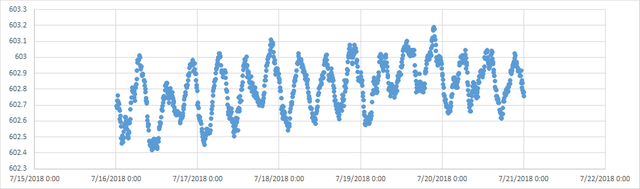
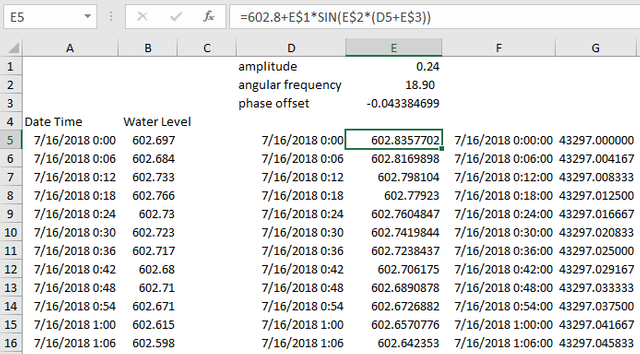
The excel spreadsheet for the data and the graph is below:
Once again we can see that the lake level goes up and down on a regular basis. Could it be due to the lunar tidal effect?
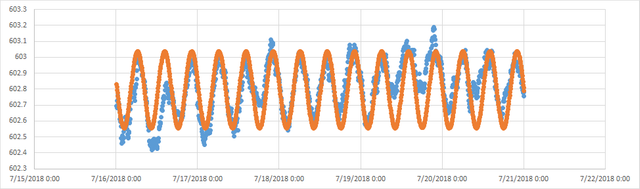
The only way to find out is to fit a cosine curve against the data and calculate the period of that curve. The results of that effort are shown in the graph below. The water level data is blue and the cosine is orange:
Calculating the Period (Method 1)
The graph shows 14 periods in the cosine curve (14 peaks from start to end) and they span a period of about 4.65 days which is about 111.7 hours. Dividing that by 14 gives me 8 hours for the time between peaks.
Calculating the Period (Method 2)
The other way to calculate the period is to use the angular frequency which is determined to be 18.9. We know the equation for angular frequency is ω = 2π/T, solving for period 'T' gives us T = 2π/ω
Plugging in the numbers yields an answer of 0.332 days or 8 hours.
The lunar tidal cycle is 12 hours and 25 minutes long meaning that there are roughly two high tides per day. To be exact there are two high tides every 24 hours and 50 minutes because the Moon is in orbit around the Earth and its position is constantly moving in the sky. The Earth has to rotate for an extra 50 minutes to catch up with it.
The lake height period from our analysis is 8 hours and does not match up with the lunar tidal cycle at all.
What could be going on?
LAKE SEICHES
Lake are constantly in flux and are subject to a sloshing effect that is called a seiche (pronounced 'seech'). Sometimes they can be surprisingly violent and have even swept fishermen out to their deaths (June 26 1954 a 3 metre seiche in Chicago swept eight fishermen out from the shore to their deaths).
A seiche is basically a standing wave in a closed body of water and are usually generated by wind action but sometimes they can be created by earthquakes.
So it looks like the data from Lake Superior is showing us the effect of a seiche which has a period of about 8 hours and has an amplitude of roughly 0.6 feet peak-to-trough (18 cm).
DON'T GIVE UP YET
The story is not over yet because there is an analysis from this web page Do the Great Lakes have tides? which indicates that the Great Lakes do indeed have tides but they are very small and can be easily lost in the noise of wind, weather and seiches.
The amplitude of the tides is claimed to be less than 2 inches (5 cm) in height so they are much smaller than the data in the curves shown above.
It would take a Fourier analysis of the data and a longer data set than shown above to tease out a cycle with a 12 hour period. In fact that is a good idea for the subject of another post and I may get around to doing just that.
CLOSING WORDS
So theoretically the Great Lakes do have lunar tides but it would take a more sophisticated analysis to tease that answer out of the data than done here in this post.
However, the simple analysis shown above tells a few things about Lake Superior. It has seiches and those seiches appear to have a period of 8 hours. This means that the entire lake is slowly sloshing back and forth about three times a day.
The other unusual thing about the data is that there seems to always be a peak in the morning at about the same time. This might be due to:
- The changeover from the offshore wind at night to an onshore wind during the day (when the ground heats up and causes the local wind to change direction).
- The very slight driving effect from the Moon as it passes overhead each day. If Lake Superior has a seiche period of 8 hours then three seiche periods is close to 2 lunar tidal periods and there may be a resonance effect going on here.
Thank you for reading my post.
OTHER POSTS IN MY RECREATIONAL MATH SERIES
- Testing the excel random function.
- Make Your Own Bell Curve.
- Strange Attractors.
- Let's Travel To Alpha Centauri.
- Calculate Sunset and Sunrise Times.
- Conway's Game of Life.
- Caffeine Half-Life.
- Let's Simulate a Radioactive Sample.
- A Slow Boat to "π-na".
- Journey Through the Centre of Psyche.
- Star Trek Into Darkness.
- Calculate Sunrise and Sunset Times Using Python.
- Two Weird Ways to Calculate Pi (Using Python)
- Blow Your Mind With Tupper's Self-Referential Formula
- The Generalized Collatz Conjecture
POST SOURCES
Do The Great Lakes Have Tides?
NOAA Great Lakes Online
NOAA Station Selection
Duluth Station Water Level Gauge
Lake Seitches Explained - Wikipedia
NOAA Statement of Release of Data and Image to the Public Domain
Tides - Wikipedia
Get Automated DAILY upvotes! FREE
steem.link/more
Get 0.1 Free Steem Just To Join
As always an interesting post. A Fourier transform over a large number of samples would be interesting indeed.
Wonderful article. Definitely a question that came to my mind once and I am excited you addressed it. I expected the answer to be a solid 'no'. It is interesting that there is supposed to be a measurable effect. The article on your link is fairly short, so I hope we see that issue being worked on by you once again in a more extensive manner.
Congratulations! Your post has been selected as a daily Steemit truffle! It is listed on rank 3 of all contributions awarded today. You can find the TOP DAILY TRUFFLE PICKS HERE.
I upvoted your contribution because to my mind your post is at least 11 SBD worth and should receive 129 votes. It's now up to the lovely Steemit community to make this come true.
I am
TrufflePig, an Artificial Intelligence Bot that helps minnows and content curators using Machine Learning. If you are curious how I select content, you can find an explanation here!Have a nice day and sincerely yours,

TrufflePigThis post has been voted on by the steemstem curation team and voting trail.
There is more to SteemSTEM than just writing posts, check here for some more tips on being a community member. You can also join our discord here to get to know the rest of the community!