NTES, or how charts tell stories...
I think this chart is a good example of how to use technical analysis to read stock charts. Technical analysis refers to pure chart interpretation (think swing traders and day traders). It is the opposite of Fundamental analysis, which is doing research on companies and their competitors to find long positions (think Jim Cramer of Mad Money). Technical analysis, in my opinion, is more useful for someone who wants to be actively involved in their investments.
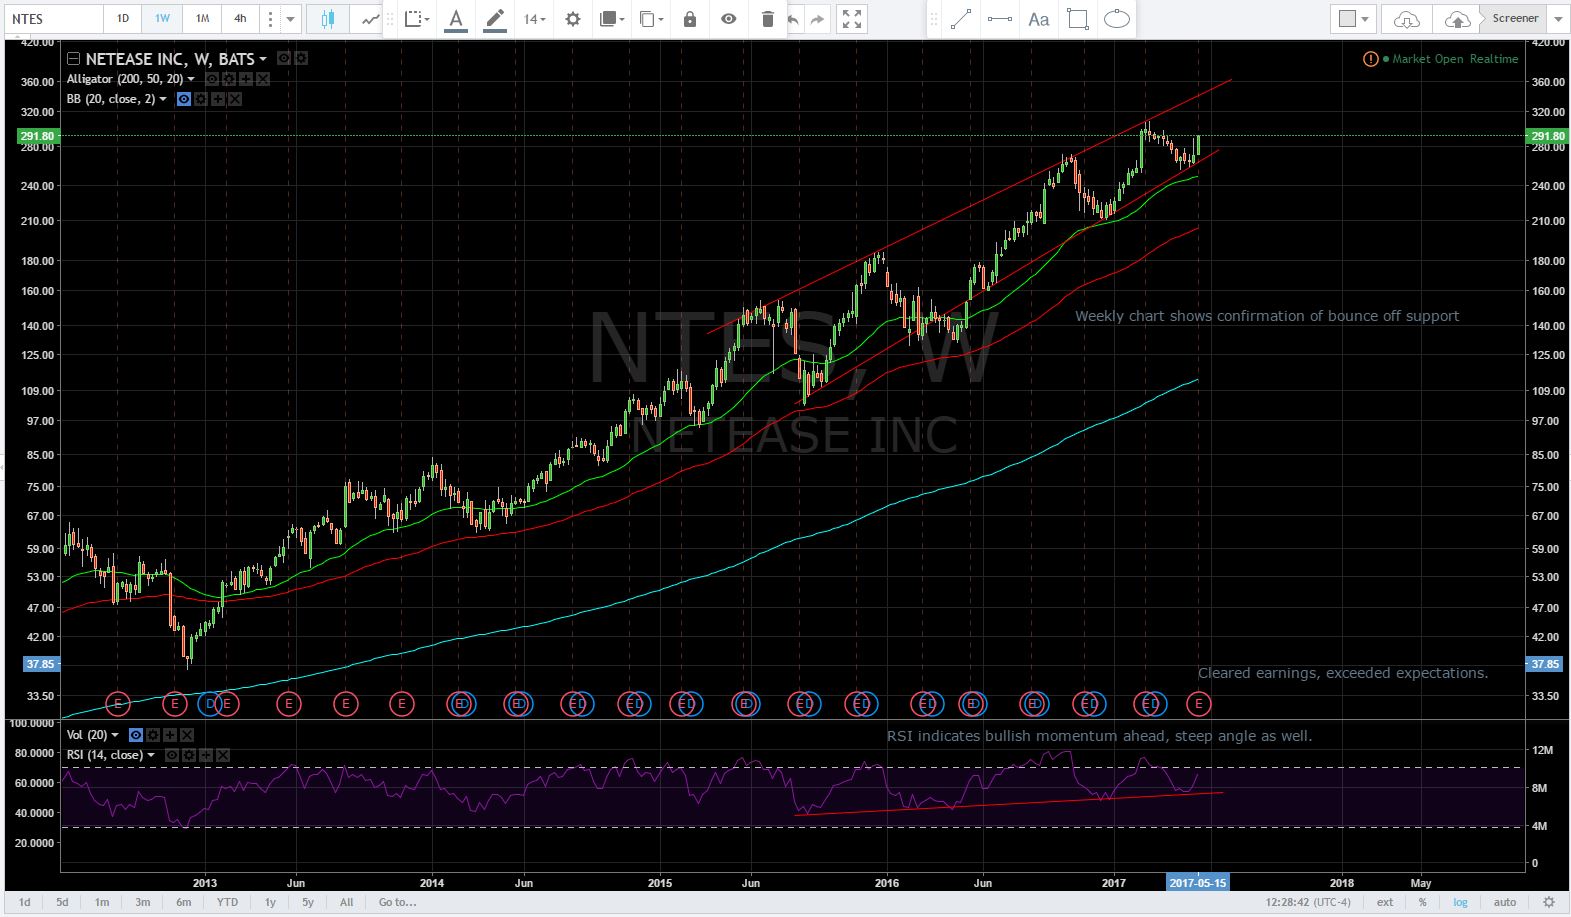
We can see above, that this stock has been behaving predictably for quite some time now. It also appears to be a good time to "buy low".
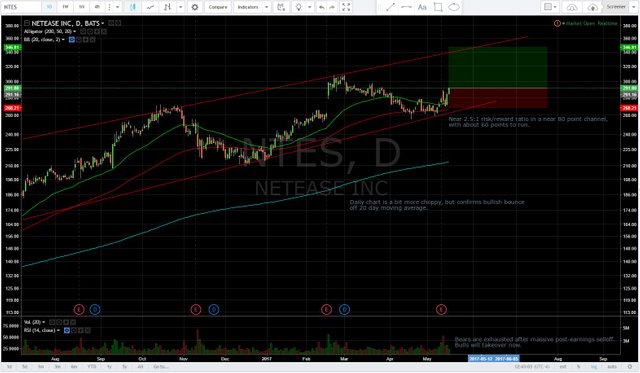
By either buying call options or buying shares, we could benefit from a potential 60 point swing. If this pattern continues...
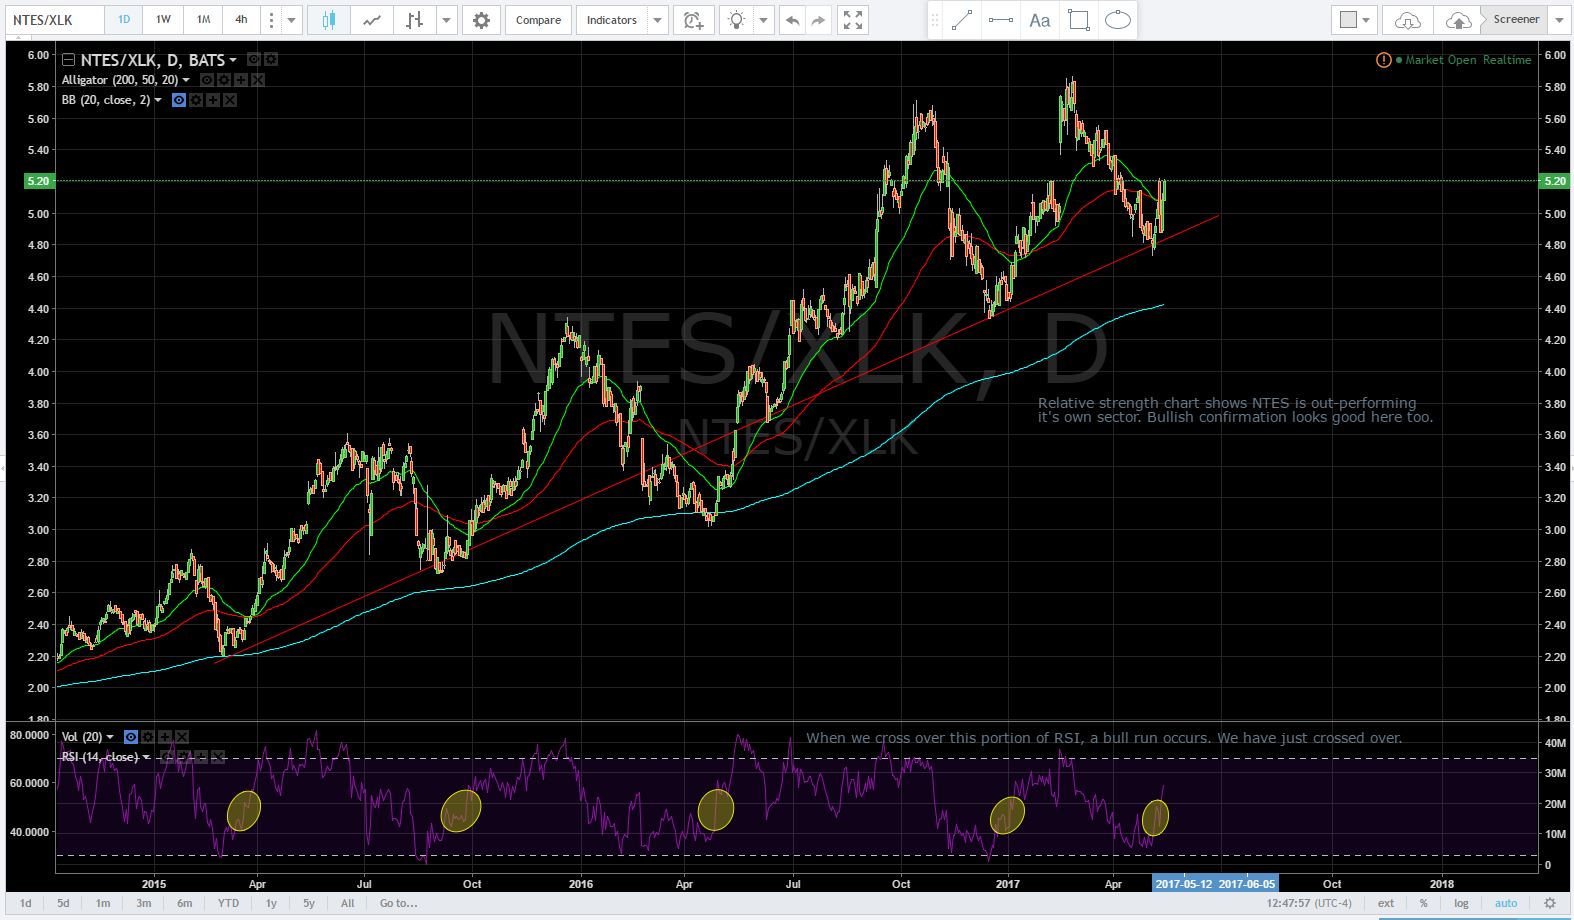
A relative strength chart shows that this particular company has been outperforming its' own sector for a while now. And if you follow the stock market, you know XLK (tech sector) has been outperforming most other sectors, which means NTES has been killing it.
I'm new to this community and I enjoy analyzing charts, for my own benefit and others'. Is this something people would like to see more of? Do people understand the basics of technical analysis or should we cover some of that in the future as well? Let me know in the comments below.
Thanks guys!
- Disclaimer – the above is not investment advice, do your own risk assessment.