Great Free Tools For Small Investors And Bloggers
(1. part) Small investors mostly don’t have the budget to pay expensive trading systems with real-time data and trading, charting tools, exclusive news, and analysis. But mostly they don’t need it either. If somebody is trying to find some cheap undervalued stocks and makes only some trades a month, or is following the “buy and hold” strategy, some free tools can be enough.
1. Investing.com+App+Widget
Stock exchanges are selling their real-time data for money and are expecting from vendors (re-sellers) of the data the same. That means, real-time (not delayed) price data is not free. Brokerage firms or banks by which you make your trades mostly provide those data for an extra fee.
Investing.com is like a “Bloomberg terminal” or “Reuters monitor” of the poor: The most important indexes, foreign exchange prices or stock prices are real-time or near real-time. I think they are hacking the “price data selling business” with CFD-prices and market makers:
All CFDs (stocks, indexes, futures), cryptocurrencies, and Forex prices are not provided by exchanges but rather by market makers, and so prices may not be accurate and may differ from the actual market price, meaning prices are indicative and not appropriate for trading purposes. (Investing.com)
Make your portfolio
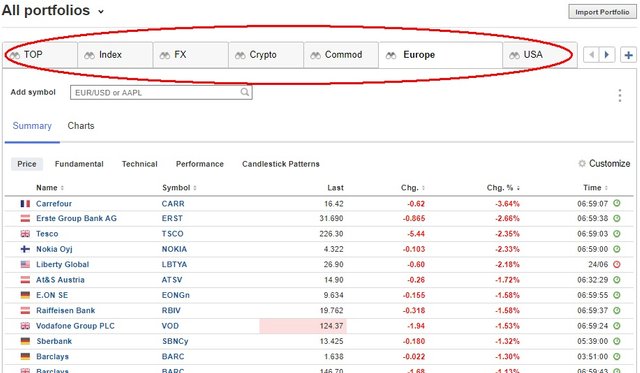
You can make your own portfolio, creating many tabs, and selecting the stocks, ETFs, currencies, commodities, also main cryptos (and Steem) price. That is very handy. (See picture. The tabs marked with a red ellipse.) The widget of the Android smartphone application can show you the first tab on your desktop. So it is useful to put there your most closely followed investment targets.
They have many more tools like economic calendar, dividend calendar, market news, crypto-news, etc. The data of the charts can be downloaded to analyze it in spreadsheets, although I suppose, it can’t be used in blog posts for copyright reasons.
2. Stockcharts.com
However, Stockcharts.com is encouraging media sites or blogs to use their charts:
you are allowed to copy/screenshot our charts into any form of electronic media for free so long as you follow the terms of our Electronic Media Reprint Policy (…) Charts must be copied manually (...) Our copyright notice, which appears on every chart, must be visible and unmodified (…) “Chart courtesy of StockCharts.com” must be placed somewhere near the chart (…) the “StockCharts.com” portion of this notice be linked to our website at (https://stockcharts.com)
Comparative charts
The free version of the chart is somehow restricted and the data covers in first line American stocks, indexes, and commodities. But if you play around with the options – especially with the color schemes – the results can be very nice. Useful in articles and posts.
You can also compare two or three products on the chart, with small tricks. On the picture, a comparison of WTI Crude oil and the SPDR S&P Oil & Gas Exploration & Production (XOP). I marked some parameters and options which I changed to produce this comparative chart.
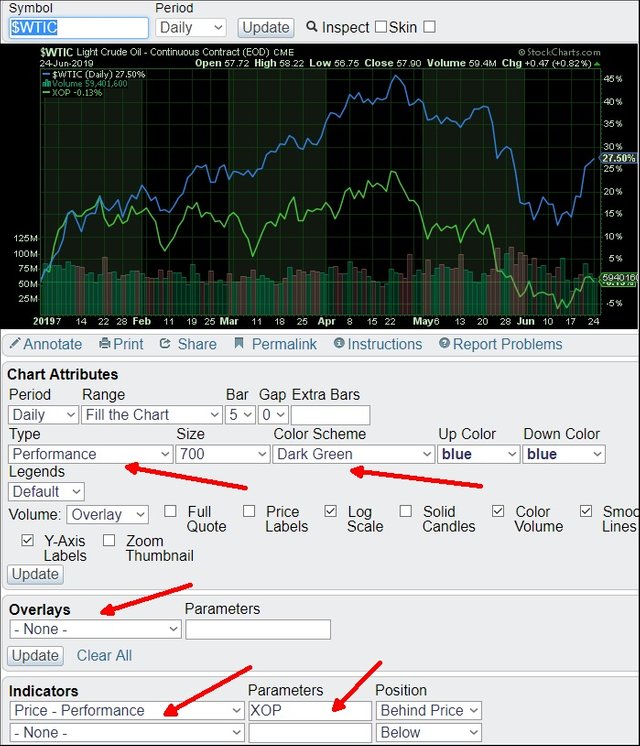
(Chart courtesy of Stockcharts.com])
Tradingview.com
Tradingview.com is also supporting the use of its charts in blog posts and other publications. As they wrote:
TradingView grants all users of tradingview.com and all other available versions of the site to use snapshots of TradingView charts in analysis, press releases, books, articles, blog posts and other publications (…) on the condition that TradingView attribution must be clearly visible at all times that such charts and products are used. Attribution must include a reference to TradingView
How to calculate backwardation?
I find it as their advantage that they have much more investment products to chart, also in the free version. Most cryptos, also Steem (here), European stocks, many commodities settlements. You can calculate complex indicators, for example, contango (subtracting or dividing near-term and second term commodity prices).
I made an example with the annualized contango/backwardation of the Brent crude oil on the chart. (At the moment, backwardation.) This is very important for commodities investors.
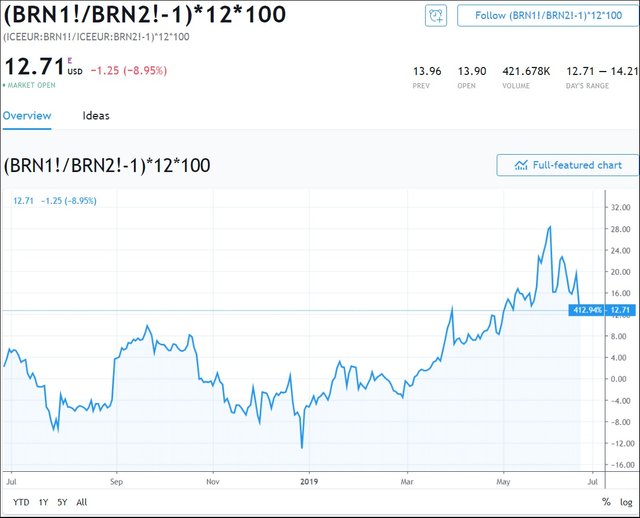
(Chart courtesy of TradingView])
(Cover picture: Pixabay.com)
(In the next part: Bloomberg.com, SeekingAlpha, Yahoo Finance, Barchart.com)
That's Amazing!