Long-Term Cryptocurrency Price Analysis: Bitcoin, Ethereum, Ripple, Litecoin
Bitcoin
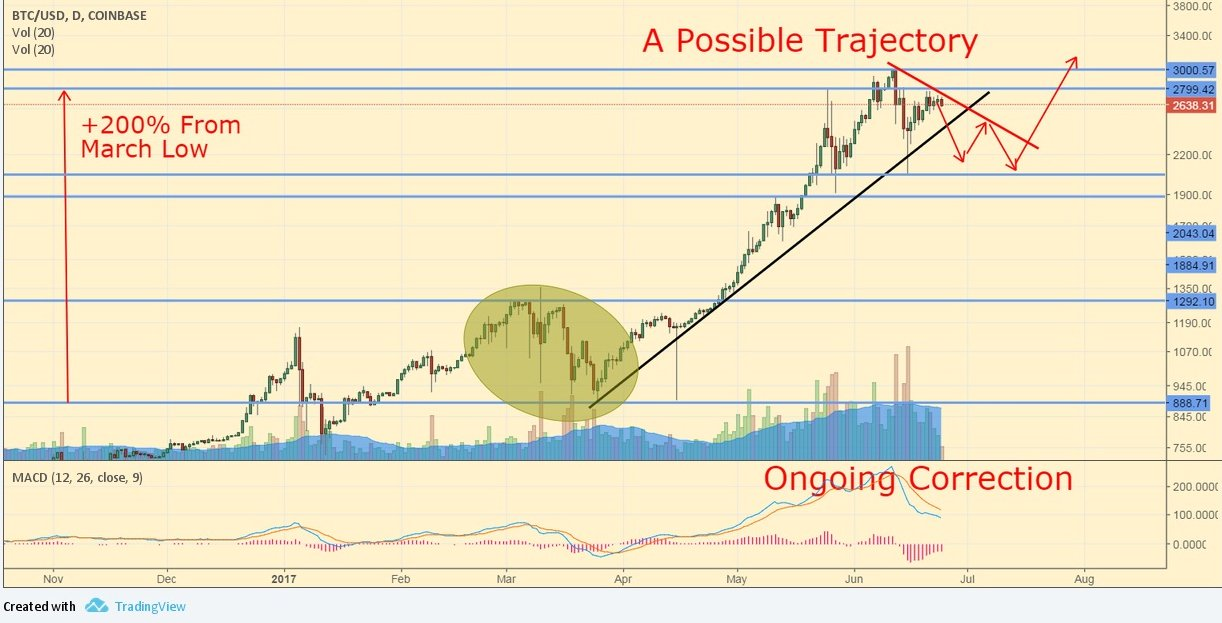
Daily Chart of BTC/USD
Bitcoin has cleared a part of its overbought state since hitting a high near $3000, but usually, BTC corrects in a more complex way after a huge rally, as you can see with the example of the March correction (we noted a possible trajectory for the correction). We expect more corrective action in the coming period that might provide more great buying opportunities for long-term investors. We still think that short-term BTC is vulnerable, and a re-test of the previous short-term low is possible. A move about $2800, on the other hand, would trigger a new buy signal.
Ethereum
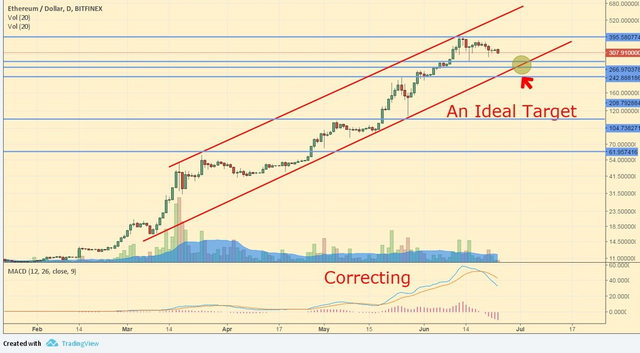
Daily Chart of ETH/USD
ETH is still in a similar technical position to Bitcoin, being in a clear corrective phase after the monster rally. We expect more consolidation in the coming period, with a possible move back to the $250-$270 range that supported the coin during the previous move lower. ETH is still well inside the strongly rising trend, which converges with the support range in about a week, providing an ideal target for the correction.
Litecoin
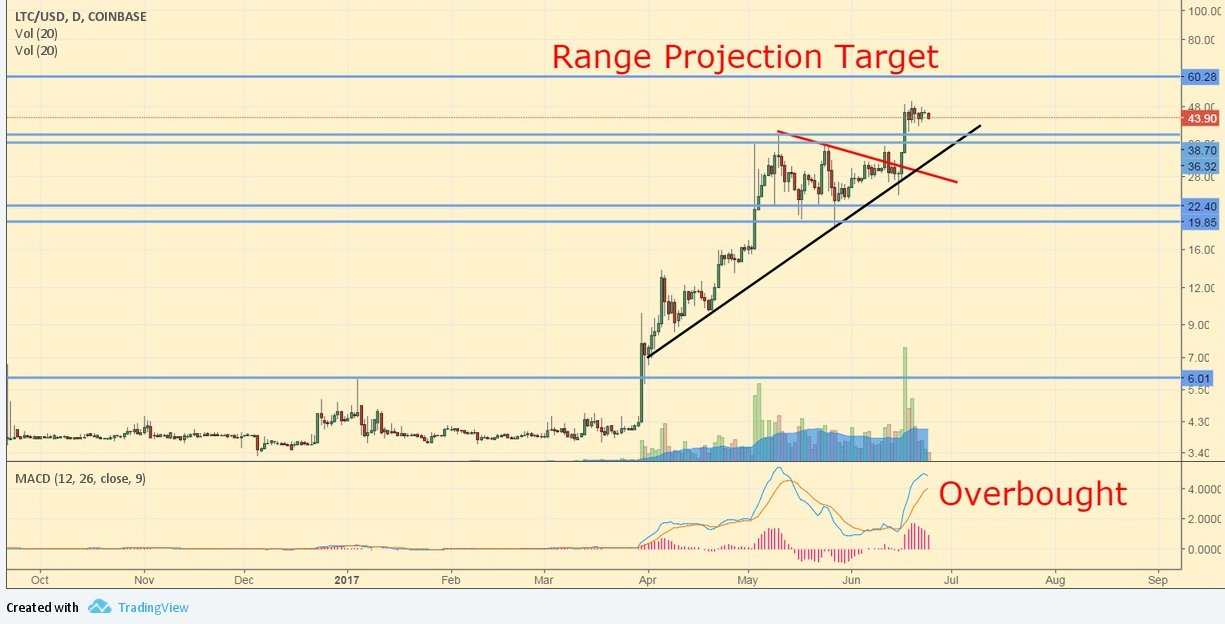
Daily Chart of LTC/USD
We wrote two weeks ago that:
Litecoin’s chart is looking promising from a long-term perspective, as LTC is after a lengthy and deep (-55%, after 1000% of gains in 5 weeks) correction, while several signs point to a bullish turning point. (…)While it is entirely possible that LTC will consolidate more if Bitcoin enters a correction, it will likely outperform both BTC and ETH in the coming weeks.
The chart now is out of the buy-zone as the MACD is already overbought, but the break-out move is still intact, and another move higher, possibly towards the range-extension target at $60, is in the cards, new positions are riskier here than previously. The long-term rising trend is intact and we advise investors to hold on to their core positions.
Ripple
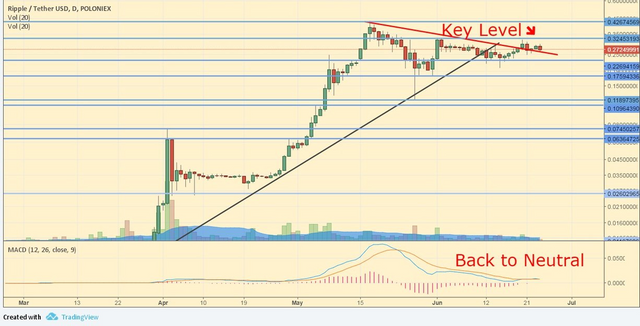
Daily Chart of XRP/USD
Ripple has lagged Litecoin and failed to produce a sustained break-out so far after its lengthy consolidation period. The MACD indicator is still in neutral territory, but it hasn’t given a clear long-term buy signal yet. Long-term investors could still add to their existing XRP positions here, while short-term traders could try to buy the break-out attempts, as they provide a good profit/risk ratio thanks to the long-term picture.
Here are some of the possible strategies once again:
~Buy and hold, without caring about day-to-day (or even month-month) fluctuations
~Buy and hold a core position and add on the major dips; a very powerful strategy
~Buy a certain amount every week or month, and even-out your entry price, without the hassle of timing the market
~Try to catch major turning points to reduce and “re-boost” your position
~Trade short-term movements with stop-losses, targets, and strict risk management (this is trading not investing)”
I would wait for more definite reversal/buy signals (starting with the hourly charts), because it was not about a pair of coins, but the whole market was down. Lets just wait for a week.
Nice post!
Solid post. Nice to see I'm not the only one who thinks like this. The price of a coin should depend on the quality of the product, the team behind it, if proffesional investors believe in it, and a lot more facets. I found this great website: https://www.coincheckup.com It's a great site that gives in depth research on every tradable cryto in the market.