TIB: Today I Bought (and Sold) - An Investors Journal #468 - Silver, Gaming, US Industrials, Technology Services, Nasdaq Index.
Markets show something of a rotation as yields and oil rise. Trade action is mostly about hedging trades looking for a continued rolling over and some tidying up on options due to expire in 10 days.

Portfolio News
Market Flip Flop
US markets opened mostly positive and then diverged during the day
Two big sets of moves in my portfolios. The rise in Treasury yields buoyed financial stocks, especially banks.
Metropolitan Bank (MCB) up 5% and Huntington Bancshares (HBAN) up 4.6%. Financials stocks also moved up in Europe, led by Italian bank, Intesa Sanpaolo S.p.A. (ISP.MI) up 6%.
Biggest surprise was in smaller scale oil plays and oil services

Chesapeake Energy (CHK) up 19.6% and McDermott International (MDR) up 17.9%. The Van Eck Oil Services ETF (OIH) was up 6.3%. The headlines suggest that is driven by oil price expectations with a new Saudi Oil Minister, Prince Abdulaziz bin Salman, appointed
https://www.fool.com/investing/2019/09/09/why-oil-and-gas-stocks-are-in-rally-mode-today.aspx
Britain Bumbles
Boris Johnson bumbles and loses again
No real change in UK Parliament with 2nd attempt to call a snap election defeated. Royal assent arrives for proroguing Parliament. Now it is time for the government to work out what sort of deal they can present to EU Summit on October 17. Brexit will be extended to January 31, 2020 unless an exit (deal or no deal) is approved by MPs on October 19.
https://www.bbc.com/news/uk-politics-49630094
Cannabis Carnival
Canadian marijuana stocks all pull back after the recent run to levels where I bought last week.
Bought
iShares Silver Trust (SLV): Silver. Price has been trading above $15.50 since early August. I am currently holding an open ended 15.5 strike call option. I put in an offer to close that trade at the Ask. Meanwhile I added a December 2019 17/20 bull call spread with a net premium of $0.63 offering maximum profit potential of 376% if price moves 18% from $16.87 opening price
I continue to hold the stock in this portfolio.
Sold
Industrial Select Sector SPDR Fund (XLI): US Industrials. watched a CNBC Options Action piece on relative performance of Industrials to S&P 500. View was that price had broken the uptrend and was retesting and could turn over. The chart shows the under-performance of XLI - black bars since the 2018 highs. The key aspect is chart shows 3 lower highs with price testing back up to that top level again.
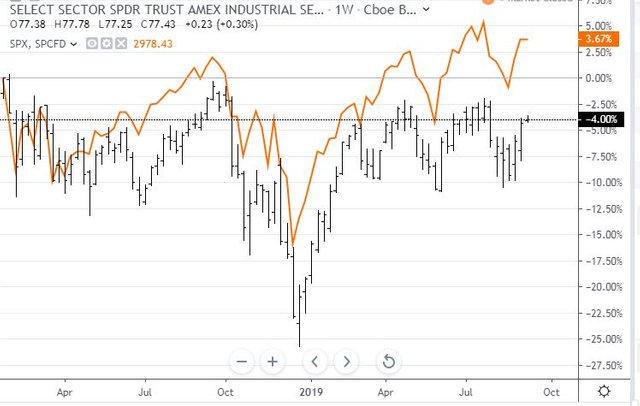
I was holding a long call spread risk reversal with expiries further out than the trade idea they presented. I decided to take off the long trade. This entailed closing out the January 2021 75/80 bull call spread (for a small loss - 6%) and buying back the January 2020 strike 72 put option for a profit. Overall the trade was profitable - profit percentage cannot be calculated as the original trade resulted in a negative net premium (i.e., I got paid). Quick update of the chart which shows the levels of the 3 elements. Starting date is start of the bought call (75) - blue ray. Expiry date for the sold put is the vertical green line. The other went out further in time.
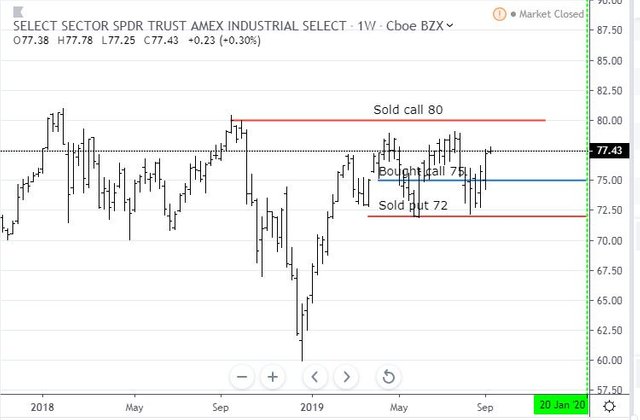
The original trade idea was a longer view based on China trade deal and Boeing (BA) problems being resolved before the call spread expiry (January 2021). Price has had two chances at reaching up to the sold call level and failed both times - no China deal and Boeing is not fixed). The CNBC team view was that this next time it would fail again and we could well see a fall again. See TIB397 for the initial discussion.
Shorts
Industrial Select Sector SPDR Fund (XLI): US Industrials. Replaced the long XLI trade with a December 2020 76/70 bear put spread with a net premium of $1.44 offering maximum profit potential of 316% if price drops 10% from $77.20 opening price. Let's look at a chart which shows the bought put (76) as a blue ray and the sold put (70) as a red ray with the expiry date the dotted green line on the right margin
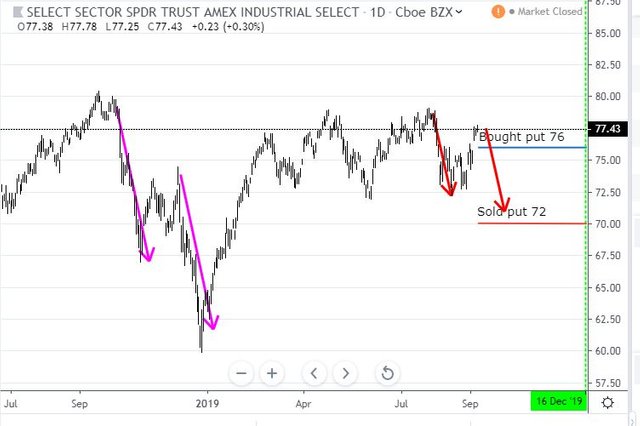
I have modelled two price scenarios. The red arrow shows that the trade will get close to the maximum depending on when price turns over - I will need to watch this evolve as we could well see more than one cycle between now and expiry. Of note is expiry is after the next earnings season. Of course a pink arrow price scenario will see a comfortable win - and that is why I took off the long trade.
In the cold light of day I noticed that I just bought back a January 2020 strike 72 put and sold a December 2020 strike 70 put. Better trade would have been to look to January 2020 expiry on the long put - 76 strike traded at $2.79 which is lower than the premium I received for the 72 put sold in April 2019.
ProShares UltraPro Short QQQ (SQQQ): Nasdaq Index. Added to hedging position in one portfolio and immediately wrote covered call
Expiring Options
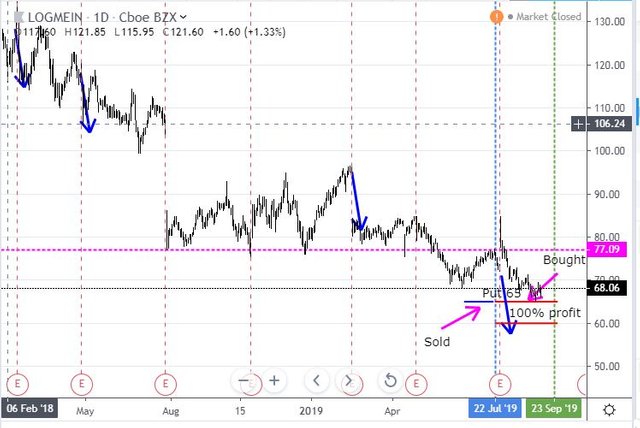
LogMeIn, Inc (LOGM): Technology Services. Closed out September expiring 65 strike put option for a 72% net loss since June 2019. This was the bought half of a July/October calendar spread. Price never looked like it was going to go under the 65 strike closing at $68.06 up 0.95% on the day. Real Vision idea discussed in TIB437 - never worked out. Quick update of the chart. The trade idea was that earnings could disappoint and price would collapse. It did not - price spiked higher and then drifted lower again.
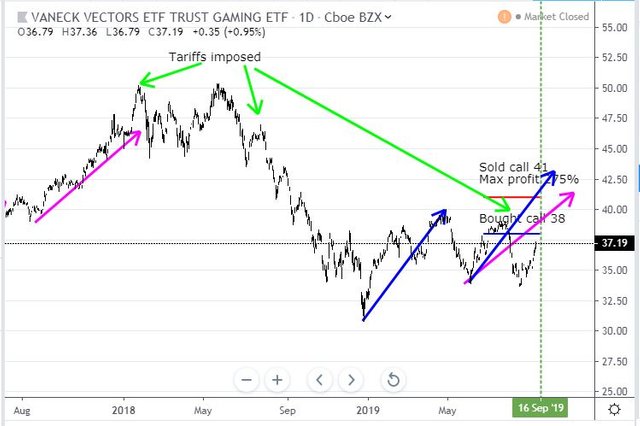
VanEck Vectors Gaming ETF (BJK): Gaming. Closed out 38/41 bull call spread for 94% loss since June 2016. This is the 2nd consecutive losing trade on the idea. Price moved up 1.4% in the day to close at $37.36 - might have been a hasty exit. The challenge with this holding is the degree of exposure to Macau which depends on a happy China = not got that right now. See TIB442 for the trade set up. Quick update of the chart which shows that price ran out of steam with the new round of tariffs announced in August - now the trade has run out of time
Income Trades
ProShares UltraPro Short QQQ (SQQQ): Nasdaq Index. Sold September 2019 strike 36 calls for 0.79% premium (0.79% to purchase price). Closing price $31.47 (lower than last trade). Price needs to move another 14% to reach the sold strike (new trade). Should price pass the sold strike I book a 14% capital gain.
Cryptocurency
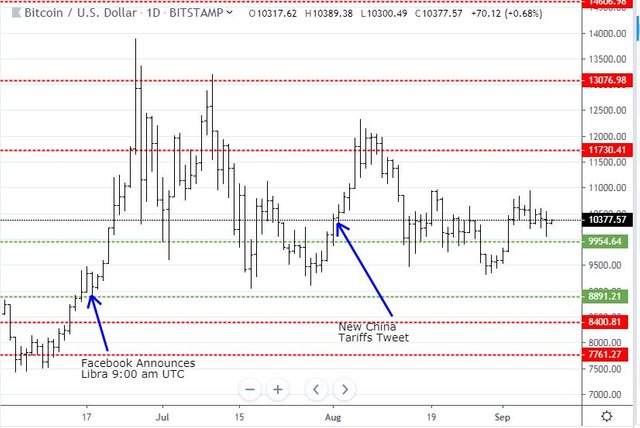
Bitcoin (BTCUSD): Price range for the day was $482 (4.6% of the high). Price pushes lower but manages to hold above $10,000 and closes pretty well where it opened. Two lower days is poising possibly for a move higher.
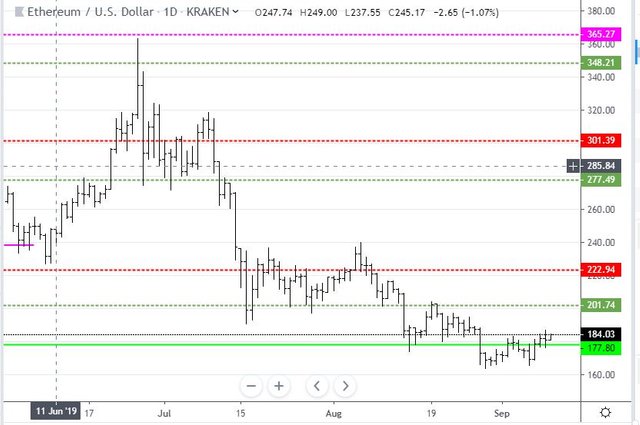
Ethereum (ETHUSD): Price range for the day was $11 (6.3% of the low). Price makes an engulfing bar and a higher high with the $177 support level holding ground. This looks like it wants to push higher.
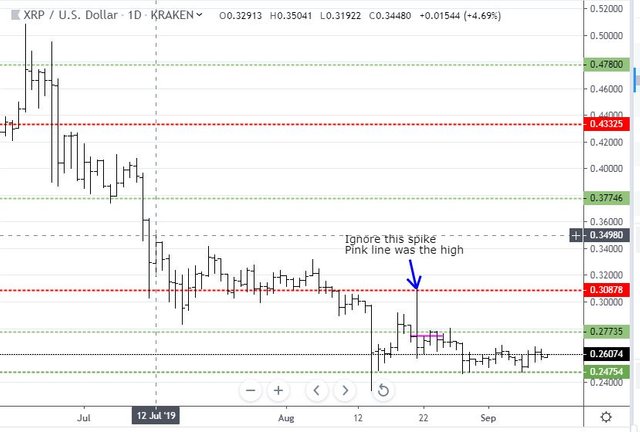
Ripple (XRPUSD): Price range for the day was $0.00841 (3.2% of the high). Price makes an inside bar and closes above the $0.26 level.
CryptoBots
Profit Trailer Bot No closed trades. I did increase open pairs to unblock trading. One new trade opened on ZRX
New Trading Bot Trading out using Crypto Prophecy. No closed trades
Currency Trades
Outsourced MAM account Actions to Wealth closed out 3 trades on AUDNZD for 0.25% profits for the day. Trades open on USDJPY short (0.96% negative)
Cautions: This is not financial advice. You need to consider your own financial position and take your own advice before you follow any of my ideas
Images: I own the rights to use and edit the Buy Sell image. News headlines come from Google Search. All other images are created using my various trading and charting platforms. They are all my own work
Tickers: I monitor my portfolios using Yahoo Finance. The ticker symbols used are Yahoo Finance tickers
Charts: http://mymark.mx/TradingView - this is a free charting package. I have a Pro subscription to get access to real time forex prices
Bitcoin: Get started with mining Bitcoin for as little as $25 http://mymark.mx/Galaxy
September 9, 2019

I am surprised that the return from Summer has not moved markets more given the implied uncertainty when measured in the VIX. However, I think that can change around the time the Fed decides its next interest rate move.
Posted using Partiko iOS
There is a lot of rotation activity after the break - rebalance and then move is what they seem to be doing.
Hi, @carrinm!
You just got a 0.39% upvote from SteemPlus!
To get higher upvotes, earn more SteemPlus Points (SPP). On your Steemit wallet, check your SPP balance and click on "How to earn SPP?" to find out all the ways to earn.
If you're not using SteemPlus yet, please check our last posts in here to see the many ways in which SteemPlus can improve your Steem experience on Steemit and Busy.