TIB: Today I Bought (and Sold) - An Investors Journal #404 - Offshore Oil Drilling, Semiconductors, Oil, Oil Services, US Retail, Banks, HR, Defence, Covered Calls
Markets like the certainty of data. Earnings beats help. Trade action focuses on oil and oil services and some buying back after the covered call assignments last week. Big session on income trades in US and Europe.

Portfolio News
Market Rally
Solid earnings continue to drive markets
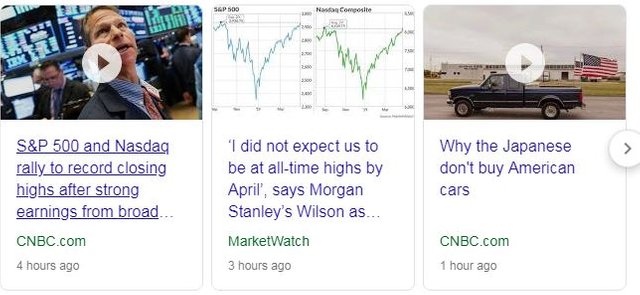
The talking heads were all over the earnings reports from the big consumer names. When Coca Cola (KO) and Procter & Gamble (PG) and Kimberly Clark (KMB) can beat by more than 5%, we know that the economists and the doomsayers were all wrong about an earnings recession. Looks like we will end up with earnings growth of between 1 and 2% vs an expected -2.5%.
And then the talking heads turned to the Bear Stocks - stocks that are well off their highs, like General Electric (GE) and Fedex (FDX) and Biogen (BIIB) - as candidates for buying perhaps. These are tricky times when the talking heads start to flip flop between doom and gloom and boom and bust - all in a few sentences.
Now Treasury markets are always a good way to read things.
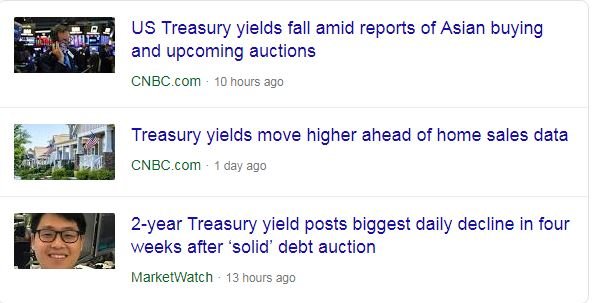
The headlines do not help - 3 ways markets can go and the headlines say all 3 are going at once. Treasury markets are clearly not unhappy - if they were we would know which way it was going. I will ride with the earnings data - at least it is more data than sentiment driven.
Oil prices were a big driver for markets too
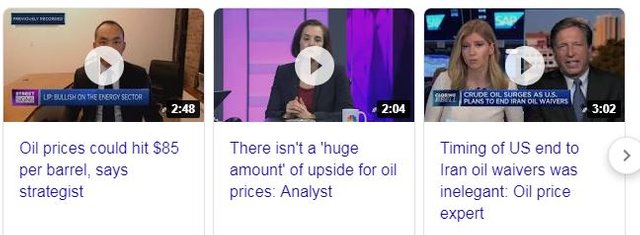
One headline comes to mind here on the timing of the ending of the Iran waivers. Donald Trump always seems to have a negotiation or distraction angle on everything he does. Was he?
- Holding intelligence that the Sri Lanka Easter Sunday attacks were supported by Iranian funded terror groups
- Looking for leverage on China as trade talks hit obstacles
- Confident that US oil shale producers can ramp up production in addition to increases from Saudi Arabia and United Arab Emirates. US production will be important as US heads into driving season
- Confident that Iran will not close the Straits of Hormuz to blockade Saudi and UAE oil flows
Jim Cramer discussed the oil patch against the background of the sanctions waiver being withdrawn. Add in the Anadarko/Chevron deal, his view is that the Permian Basin operators all come into play as potential acquisition candidates, especially if there is truth in the story that Occidental's (OXY) higher offer for Anadarko was rebuffed - Oxy will keep coming.
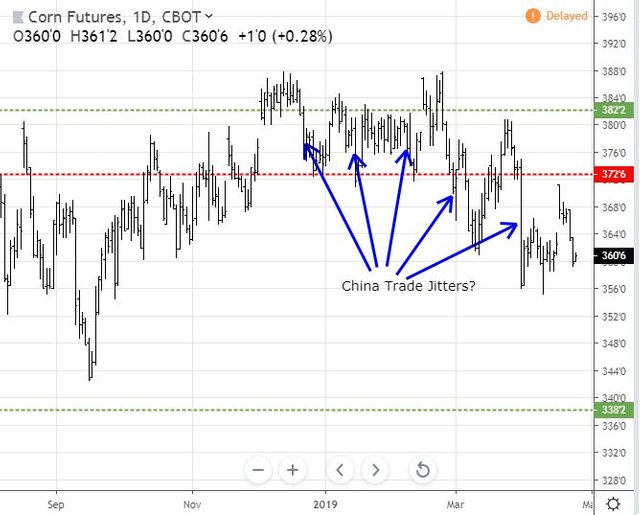
On the trade talks, my bellwether pricing model suggests that things are not that rosy on that front. Everytime there is a bump, price of corn falls. I do note that Steve Mnuchin and Robert Lighthizer are flying to Beijing next week.
Oil Services
Emerge Energy Services LP (EMES) Enters into Restructuring Support Agreement. Portfolio holding identified by my investing coach some time ago. He liked to find beaten up stocks that were breaking up from a downtrend. The challenging part is how to identify winners and losers and how to avoid those that do not have financial strength - good example here. I did like EMES as they seemed robust enough and they had exposure to oil storage as well as to oil services technologies (they are sand suppliers used for fraccing). We missed the financial risks.
https://finance.yahoo.com/news/emerge-energy-services-lp-enters-204802867.html
Bought
Intel Corporation (INTC): US Semiconductors. Rounded up holdings in one portfolio to get to 100 shares so I could write covered calls.
Van Eck Vectors Oil Services ETF (OIH): Oil Services. With oil prices rising I took the chance to average down entry price in one of my portfolios. This has been a frustrating investment which has not really performed in line with oil prices. Focusing in, the chart compares OIH (black bars) with US Oil Fund (orange line) first
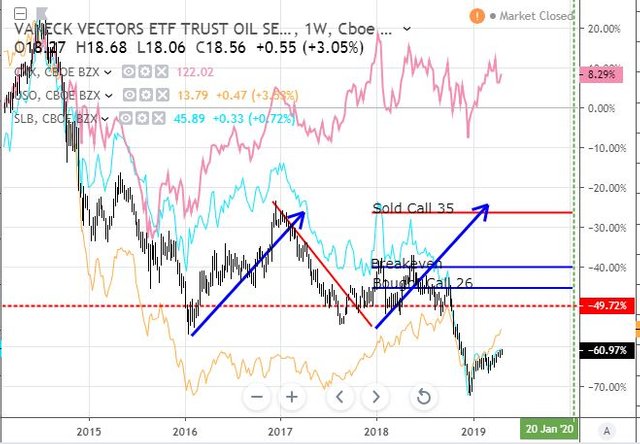
From the 2017 oil lows, OIH has basically tracked sideways in a 15% points wide range and then collapsed in the October selloff. Contrast one of their main customers, Chevron (CVX - pink line) which recovered from mid 2015 lows and has been moving ahead progressively. In this portfolio, I was already holding OIH and averaged down to replace the Schlumberger (SLB - blue line) stock that was assigned on last month's covered calls. As it happens the OIH and SLB charts are almost identical but there is less company specific risk in holding the ETF. Dividend yield is 1.74% vs SLB's 4.59%. Time to add back Schlumberger.
Apache Corporation (APA): US Oil Production. Mentioned by Jim Cramer as a potential acquisition candidate. They are well placed in the Permian Basin. I looked at the charts after doing the trade. The chart compares Apache (black bars) to the industry (using SPDR E&P ETF (XOP - blue line)), Devon Energy (DVN - red line), Alerian MLP ETF (AMLP - purple line) and Anadarko Petroleum (APC - yellow line).
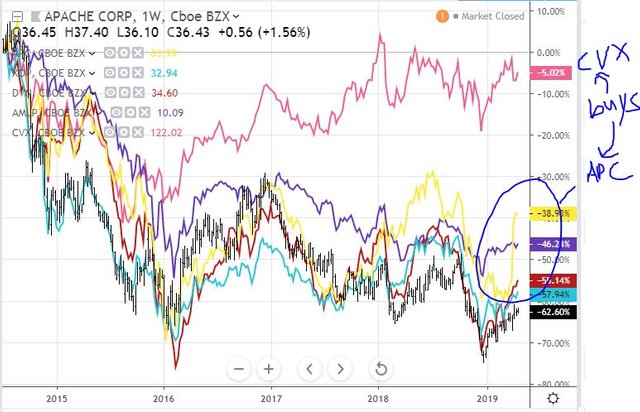
The spike in the yellow line is what this trade is all about and the acquirer, Chevron (CVX - top pink line) does know what it is doing. What I like is Apache has the biggest distance to go and it has bounced off the lows. Close half the gap and Apache share price will come close to doubling.
Alerian MLP ETF (AMLP): US Midstream Oil. This ETF invests in midstream oil partnerships who do have coverage in Permian Basin and will benefit from higher oil prices. I averaged down my entry price in one of my portfolios. It is the purple line in the Apache chart above.
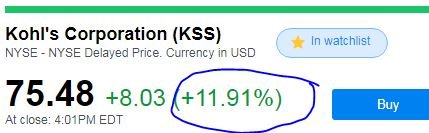
Kohl's Corporation (KSS): US Retail. Jim Cramer added to his portfolio holdings in prior day trade. I followed him in the pre-market. Kohls announced that they would start accepting returns for Amazon in their stores. Price spiked on the open - so much so that my regular hours bid was not taken up in one portfolio. I love getting a 12% spike for free.
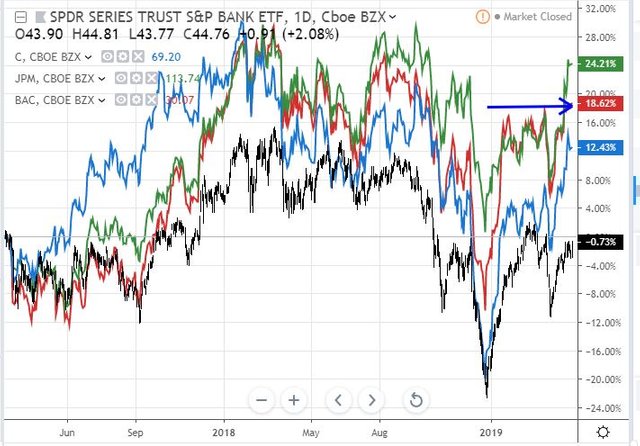
Citigroup Inc (C): US Bank. Replaced holdings assigned in Citigroup and JP Morgan with a small holding in Citigroup. Stuck with Citigroup (C - blue line) as they have under-performed JP Morgan (JPM - green line)) and Bank of America (BAC - red line) over the last 24 months or so - close the gap is the trade idea. Half the gap would bring Citigroup in line with Bank of America. Citigroup is ahead of the banking sector (SPDR Banks ETF - KBE - black bars)
ING Groep NV (INGA.AS): Dutch Bank. Bought back stock assigned in last month's covered calls. ING is the best performing European Bank and nicely exposed to a range of countries outside Europe = less affected by Draghi's negative interest rates. See TIB379 for the discussion on ING. Dividend yield is now 7.57% (was 8%) with Price to Book at 0.95 (was 0.85). Price Earnings ratio is 9.80 which is half the S&P500.
Randstad NV (RAND.AS): Europe HR Services. Bought back stock assigned in last month's covered calls. Dividend yield is 5.22%
Sold
Tidewater was Gulfmark Offshore (TDW) Two partials fill for 64% profit since December 2017 on December 24 Strike 100 call warrrants. Trading costs are becoming a factor on the partial fills - $3.17 profit reduced by $1.00 trading cost on 5 warrants sold. 2nd trade a little bigger - 49 warrants.
Shorts
Textron Inc (TXT): US Defence. Bought back short holding following trading error with 1.9% profit. I was keen to close this short when Lockheed Martin (LMT) announced stellar results, up 5.66% on the day, which was likely to drag whole defence sector up.
Income Trades
Covered Calls
24 covered calls written. A quick reminder on my process for writing covered calls.I have changed the percentage move parameters. 5% for stocks in profit. 10% for stocks under water. 7.5% for technology stocks. 20% for leveraged ETF's.
- Select stocks I am happy to sell if I get exercised.
- Calculate percentage move up in price from previous day close
- Choose a one month out call option closest to calculated move up in price.
- Place a bid between bid and ask. Ideally one should aim for a premium of about 1% to make this worthwhile - this starting list averaged 1.27%
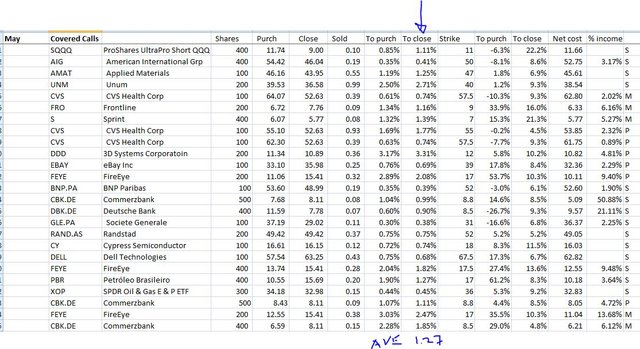
The table shows purchase price and closing price, the premium received and the % relative to close and to purchase price. The strike is shown and the important columns after that are the amount price has to move to reach the strike price - you will see they are all around 5 to 10% with a few more than that. The net cost column is updated each month to show purchase price less accumulated premium received - the percentage column at the end shows what contribution income has made compared to purchase price (blank if it is a new trade). Note: multiple trades showing from different portfolios
Naked Puts
Replaced 2 naked puts and added one new one (Honeywell - HON) with June expiries. Concept here is to sell puts at a strike price I would be happy to buy stock at. If price stays above the sold strike I get to keep the premium as income. If not, I buy back the put or buy the stock.
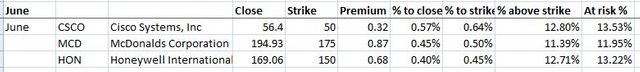
Table shows closing price, strike sold at with premium percanetages. Key colums are the % margin columns which show safetty maergins of about 10 to 15%. Premiums are lower than covered calls becasue these margins of safety are wider.
Stocks selected are all stocks that feature on Jim Cramer's Action Plus Portfolio buy lists (i.e., I am relying on his research)
Cryptocurency
Bitcoin (BTCUSD): Price range for the day was $264 (4.9% of the low). Price clears the short term high and tests through the resistance level at $5,576 as I expected, closing just below. These are heady heights last visited in November 2018 - do not be surprised to see things consolidate a little here.
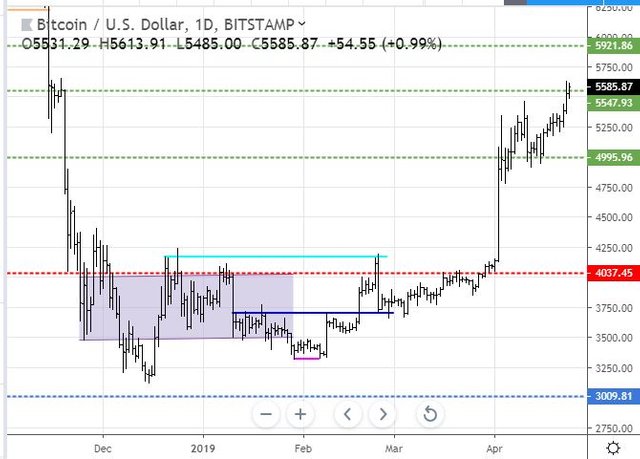
Price did not quite reach my profit target currently standing at $5657 - though it is within the range of IG Markets normal $40 wide spread.
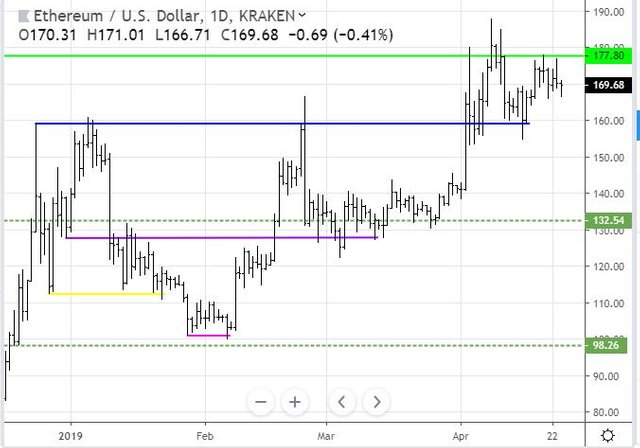
Ethereum (ETHUSD): Price range for the day was $8 (4.7% of the open). Price had another go at testing the resistance at $177 and rejected it again. Today's current price action has kept price above the prior low and if it holds like that, there is a chance of another run at breaking the resistance.
CryptoBots
Profit Trailer Bot Update next post.
New Trading Bot Trading out using Crypto Prophecy. No closed trades.
Currency Trades
Outsourced MAM account Actions to Wealth closed out 4 trades on AUDUSD and USDCHF for 1.2% losses for the day. Being short US Dollar was not a smart trade in the midst of strong earnings season. Trades open on EURCAD and USDJPY (also short) (0.03% negative)
Cautions: This is not financial advice. You need to consider your own financial position and take your own advice before you follow any of my ideas
Images: I own the rights to use and edit the Buy Sell image. News headlines come from Google Search. All other images are created using my various trading and charting platforms. They are all my own work
Tickers: I monitor my portfolios using Yahoo Finance. The ticker symbols used are Yahoo Finance tickers
Charts: http://mymark.mx/TradingView - this is a free charting package. I have a Pro subscription to get access to real time forex prices
Bitcoin: Get started with mining Bitcoin for as little as $25 http://mymark.mx/Galaxy
April 22-23, 2019

Earnings are still fundamentally broken as the only reason they are showing growth is due to buybacks. There will eventually be a time when Companies can no longer buy enough to shares to prop up earnings.
Posted using Partiko iOS
Yes buybacks are an issue especially in a low interest rate environment - and that got a whole lot easier with the last softening of yields. The biggest problem with earnings is the way buy side analysts are rewarded. It is is easy to get earnings beats if the buy side analyst reduces the estimates which is what they do.
When you do credit spreads, what type of premium are you looking for relative to the spread, meaning are you looking for $0.50 if the spread is $5?
Not sure I understand the question. I have not done any credit spreads for quite some time.
I am doing a lot of call and put spreads. I eyeball those based on likelihood of reaching the sold leg and also looking for 200% plus returns