TIB: Today I Bought (and Sold) - An Investors Journal #327 - US Shale Oil, Cybersecurity, Indonesia, US Rates, Bitcoin
Bitcoin crashes again. World markets remain under pressure and oil slides further. All my trade action is somewhat defensive covering margin, unmarketable share parcels and a few covered calls (including one fat finger trade)

Portfolio News
Market Selloff
Markets continued their downward slide in a holiday disrupted week.
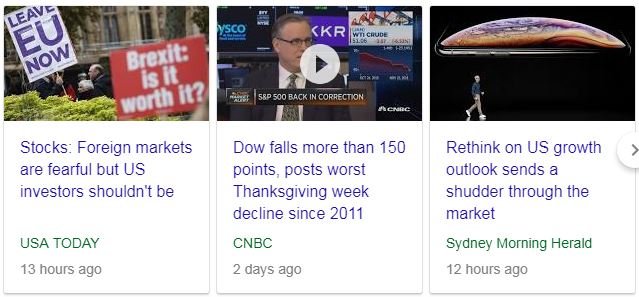
Two headlines tell quite different stories based on different perspectives. Americans are being told not to worry too much and Australians are being told to be fearful. In fact, Americans are being told that overseas problems are good for them. I read the USA Today article - all about the difference between a correction and a bear market grinding lower.
Europe Muddle news is that the EU agreed the draft Brexit deal.
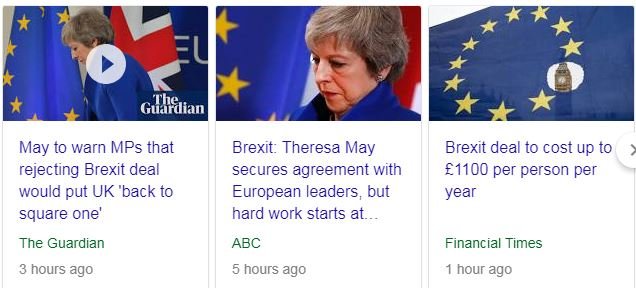
The challenge is now for Theresa May to get it past Parliament. Meanwhile, Italy continues to wrestle with words and the EU about the size of its budget deficit. What I do know is the uncertainty is playing havoc with European interest rates which made a new low (price made a new high) and banking/insurance stocks I hold in my portfolios.
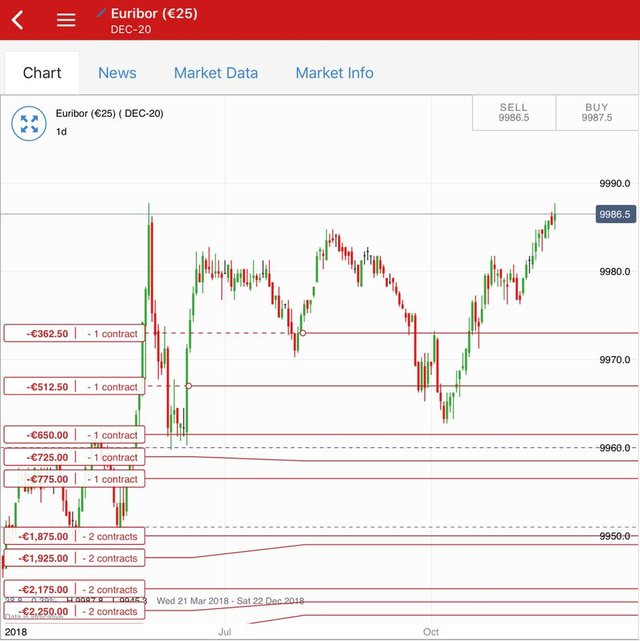
What this chart is telling us is Europe will have 0.14% interest rate in December 2020. If the US is in recession by then, which is in line with what a lot of people are saying, the ECB has a major problem. They have no room to manoeuvre to prop up the European economy.
Bitcoin Bust
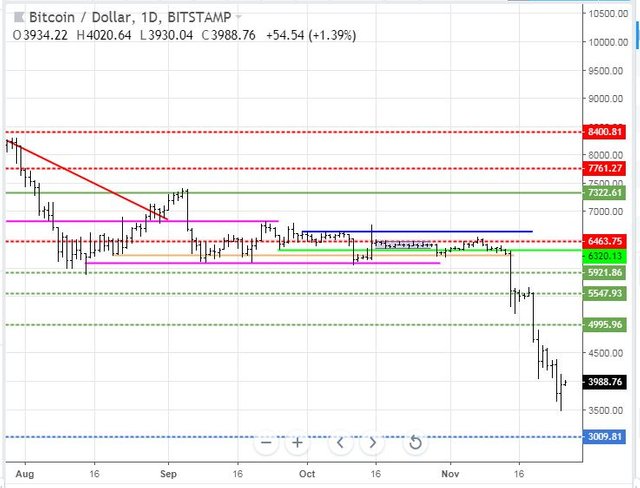
Bitcoin price has been smashed hard over the last 2 weeks and has failed to hold any support levels.
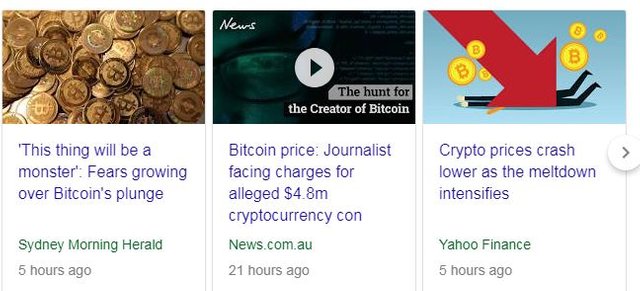
Price moves like this have been typically been driven by news catalysts - Bitcoin Cash hard fork, OKex exchange liquidating BCH futures, SEC settlements on two ICOs, postponement of Bakkt launch are the current culprits. At the current price levels, there have to be some economic drivers sitting behind it all. Time to start digging a bit deeper into the Blockchain data. The Bitcoin model builds in adjustments to difficulty of mining a block based on the amount of hash power that is available. The rational response for a Bitcoin miner is to reduce hash power when the price falls. The difficulty will then reduce and the market will find an equilibrium point. Two charts side by side to show hash rate (left) and difficulty (right).
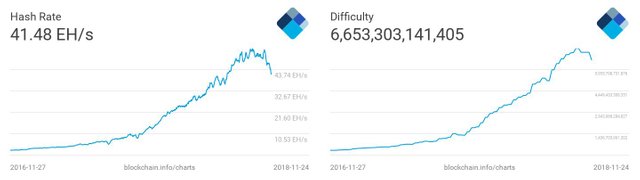
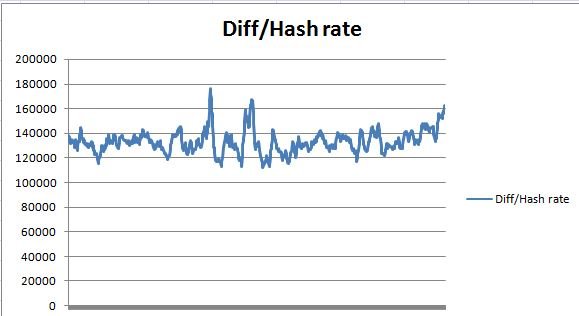
Miners have been rational and have started reducing capacity (some of this will have been diverted to Bitcoin Cash hard fork). The eagle eye will spot that difficulty has not dropped as fast as hash rate. I did plot the data points together as an index (difficulty divided by hash rate). If the chart is rising it tells me that difficulty is not dropping as fast as has rate. That suggests to me that we could well see Bitcoin price fall further until the market finds equilibrium.
https://www.blockchain.com/charts/hash-rate?daysAverageString=7×pan=2years
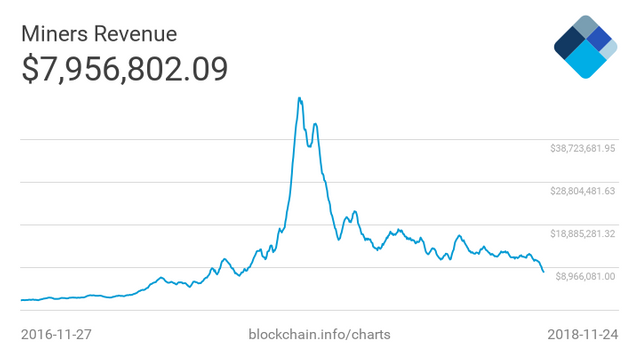
The next chart plots mining revenue over the last two years. We are back to August 2017 levels. The June 2017 high coincides with the a price of $3000 which is the lower support level on my price charts. This is the nub of the mining problem.
Now I have gone a step further and had a look at Bitcoin charts for a period in the run up to the 2017 high and compared it to the price for graphics chip maker, Nvidia stock (NVDA) (red line). I have also put in one of the video gaming stocks, Take Two Interactive (TTWO - orange line). I am looking for correlations especially to decide at what point will Nvidia reach an oversold price.
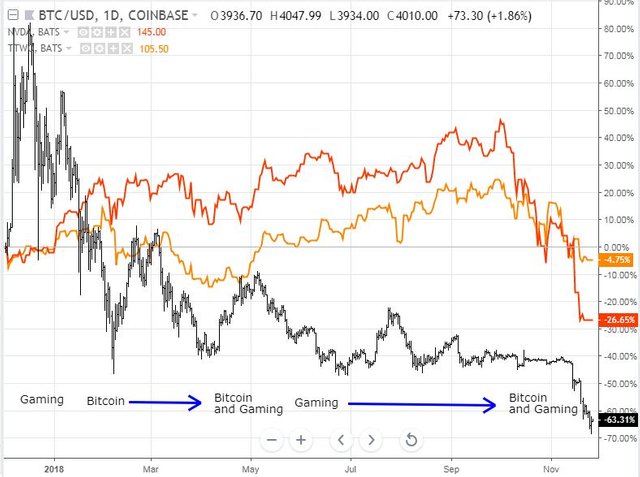
I have taken a stab at which is the dominant driver - early to mid 2018 is a combined effect with gaming becoming more influential from May as Bitcoin falls. The turnover from the September highs is a combined effect of market selloff dragging gaming down and then reinforced by the collapse of the Bitcoin price
My thought is we need to see both gaming and Bitcoin find a bottom before we can confidently buy back into Nvidia.
Bought
Big Star Energy (BNL.AX): US Shale Oil Producer. Big Star Energy was formed following the bankruptcy of Antares Energy (AZZ.AX) following the 2014 oil price collapse. I was left with unmarketable parcel of shares after the consolidation. The company is completing an unmarketable parcel sale facility. Rather than sell my small parcel, I bought a large enough parcel to retain my holding. In this portfolio, my holdings in Antares have been 12% profitable. I will be looking to squeeze out a few more percent on this small parcel and then will close out and eliminate the company specific risk. (See TIB275 for the back story on Antares)
Shorts
3-month Eurodollar Interest Rate Futures (GEZ): Closed one short contract to release margin for 6 basis points loss.
Income Trades
Two income trades booked on Friday.
iShares MSCI Indonesia ETF (EIDO): Indoesia Index. This trade was made at an incorrect strike (24 vs closing price of $24.03). I will be closing this out and reset to set up a trade at a 25 strike or higher. I could do with a selloff day to avoid having to take a loss on the buy back
ETFMG Prime Cyber Security ETF (HACK): Cybersecurity Index. Sold December 2018 strike 37 calls for 0.72% premium (0.87% to purchase price). Closing price $34.52 (lower than last month). Price needs to move another 7.2% to reach the sold strike (easier than last month). Should price pass the sold strike I book a 28% capital gain. Income to date amounts to 3% of purchase cost.
Cryptocurency
Bitcoin (BTCUSD): Price range for the weekend was $902 (20.6% of the high). Price collapsed again with test right down to $3500
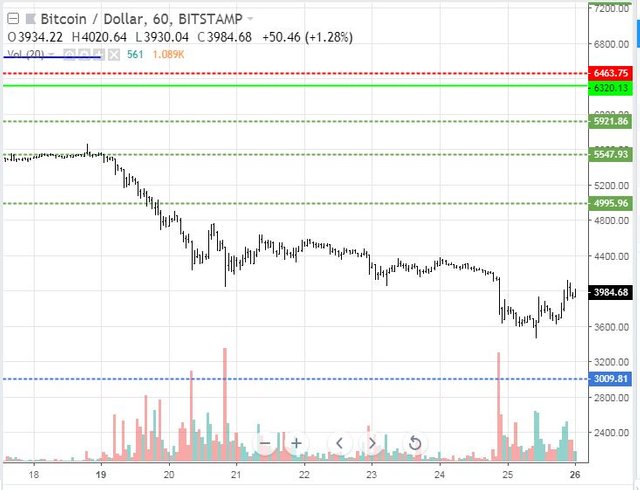
The one hour chart tells a story of two different sell off modes. The selloff on November 19 was steady selling. The selloff this weekend all happened with a spike in volume in one hour. Good news is there were buyers down at those lows.
My latest Bitmex long trade hit its liquidation price and was sold - trade is small. My IG Markets account was ringing margin bells a few times on Sunday. With markets other than Bitcoin and Ethereum closed, I could only add funds to the account or risk positions being closed. This is beginning to feel like the Last Gunfight at OK Corral
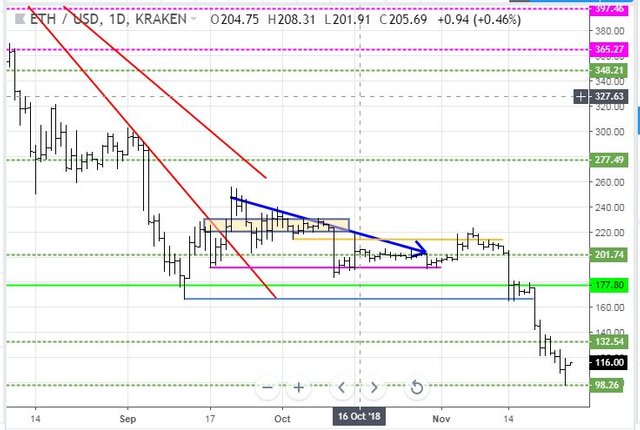
Ethereum (ETHUSD): Price range for the weekend was $28 (22% of the high). The price collapse for Ether pushed price right down to a support level from May 2017 around the $100 level. Both Bitcoin and Ether are showing low test price action. Ether might be more convincing as it is off a level, whereas Bitcoin is in "no mans land"
CryptoBots
Outsourced Bot No closed trades. (222 closed trades). Problem children now at 19 coins. (>10% down) - ETH (-72%), ZEC (-67%), DASH (-69%), AE (-20%) LTC (-54%), BTS (-62%), ICX (-87%), ADA (-76%), PPT (-85%), DGD (-86%), GAS (-88%), SNT (-66%), STRAT (-80%), NEO (-86%), ETC (-67%), QTUM (-79%), BTG (-72%), XMR (-46%), OMG (-76%).
Coins moved in a tight band of 1 or 2 points, mostly down. OMG dropped 3. GAS (-88%) remains the worst coin though ICX is getting close. STRAT (-80%) dropped a level and joined the 80% down club
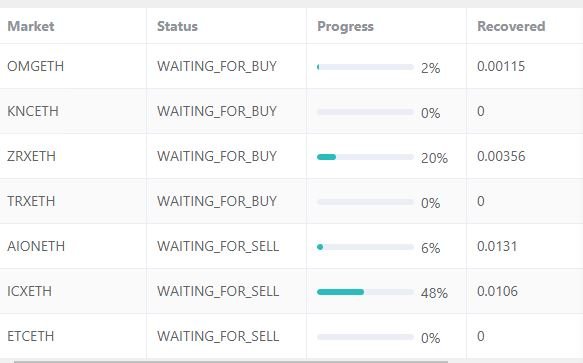
Profit Trailer Bot Two closed trades both after one level of DCA (0.87% profit) bringing the position on the account to 4.46% profit (was 4.41%) (not accounting for open trades).
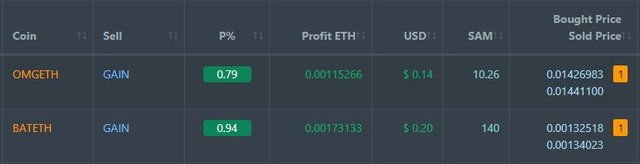
There are 4 coins on the Dollar Cost Average (DCA) list with AION falling 7 points.
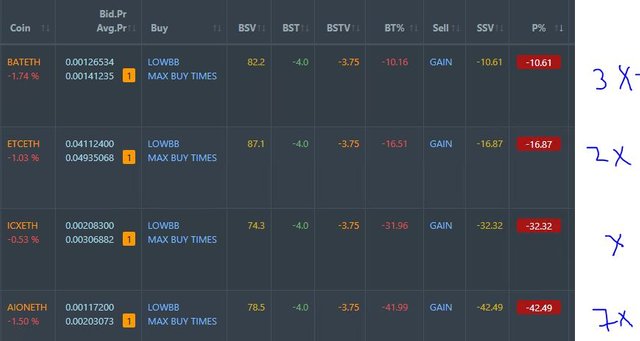
Pending list drops to 8 coins with 2 coins improving, 0 coins trading flat and 6 worse. BAT came off after closing one trade. I have elected not to put it on the PT Defender list - will wait for the last small trade to close.
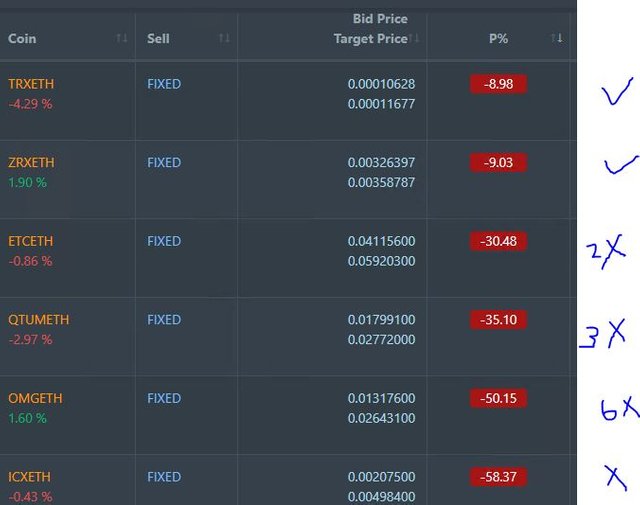
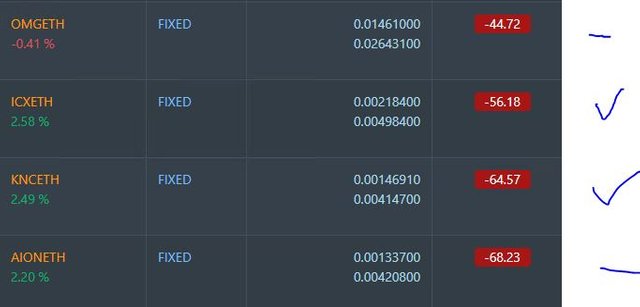
PT Defender now defending 7 coins with BAT coming off and KNC added in for the first time.
New Trading Bot Trading out using Crypto Prophecy. One new trade on FUEL partially closed (1.88% profit). I put in two profit targets on the trade - 1st one was hit in minutes. The 2nd one not and I have since moved it back to the same level as the 1st.
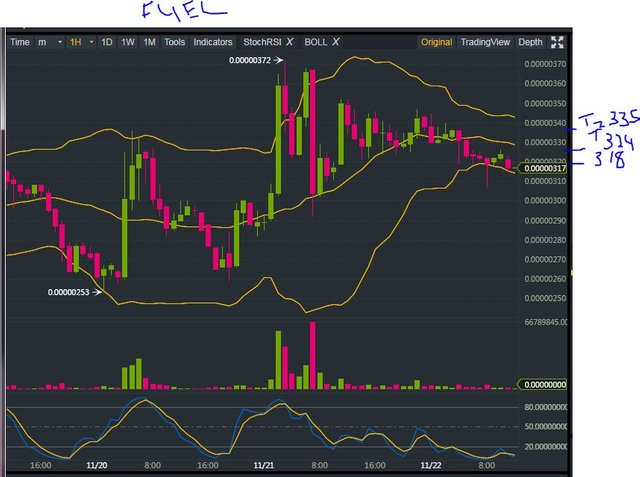
Trades remain open on XLM (new), VET, SC, TRX, FUEL.
Currency Trades
Forex Robot did not close any trades and is trading at a negative equity level of 2.6% (higher than prior 1.9%).
Outsourced MAM account Actions to Wealth closed out 1 trade for 0.1% profits for the day.
Cautions: This is not financial advice. You need to consider your own financial position and take your own advice before you follow any of my ideas
Images: I own the rights to use and edit the Buy Sell image. News headlines come from Google Search. Blockchain charts come from Blockchain.com. All other images are created using my various trading and charting platforms. They are all my own work
Tickers: I monitor my portfolios using Yahoo Finance. The ticker symbols used are Yahoo Finance tickers
Charts: http://mymark.mx/TradingView - this is a free charting package. I have a Pro subscription to get access to real time forex prices
November 23, 2018
Do you think the shale co are over leverage and the price of oil at $50 will hurt them?
Shale production costs are a lot lower than people think. The number that sits in people's heads from some old charts is around $65 per barrel - and they still use that number. More recent studies show it is anywhere between $30 and 50 per barrel. Then one has to add in pipeline costs.
https://www.investopedia.com/articles/investing/072215/can-fracking-survive-60-barrel.asp
When Antares Energy was flush with cash, they were buying their stock actively while the oil price was dropping (in 2014). They kept buying right down to $37 which tells me where their marginal cost of production was then.
With rising rates, the over leveraged firms do run high risk especially when credit spreads widen for risk grade (which they do for the oil sector). The smart move for investing in oil is through the big integrated producers (I am in BP, Royal Dutch Shell and Anadardko) or diversified through an ETF (Alerian MLP - AMLP is where I am)
Great analysis on the imbalance currently in Bitcoin metrics as it will have to come to a point were miners will need to unplug their equipment to offset declines in revenue as well. Wil be interesting to see how the market reacts with these prices coming back from the holiday in the United States.
Posted using Partiko iOS
Thanks. The hash rate chart shows how much capacity has come out. Some of my mining activities have been scaled back or mining fees increased especially with rising electricity costs and falling prices.
The big selloffs have been strongly weekend driven - that tells me selling is mostly coming from China. - where the miners are