TIB: Today I Bought (and Sold) - An Investors Journal #262 - Offshore Oil Drilling, Chemicals, US Real Estate, US Interest Rates
Markets were cruising. Then a tariff bomb was lobbed in. Ouch!!! I revisit offshore oil drilling and get back on the horse. BASF opens the door on foreign investment in China. I continue the short interest rates party and am sure hoping that the real estate idea will go right some time.

Portfolio News
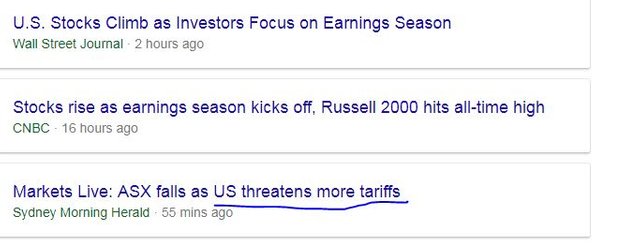
Market Jitters - Tariff Tantrum The first earnings report from Pepsico cheered the markets.
I watched the CNBC interview with Pepsico CFO before market open. He was really upbeat and ran a very good interview demonstrating how Pepsico has been steadily adjusting its business to deal with changing marketplaces. The mood about US and global markets was positive and it deserved to be as the results were great. I was impressed.
https://www.cnbc.com/video/2018/07/10/pepsico-cfo-hugh-johnston-on-earnings.html
The bad news is a "reckless" Donald Trump lobbed another $200 billion worth of tariffs onto the table after market close this time a little closer to products that will affect consumers directly.
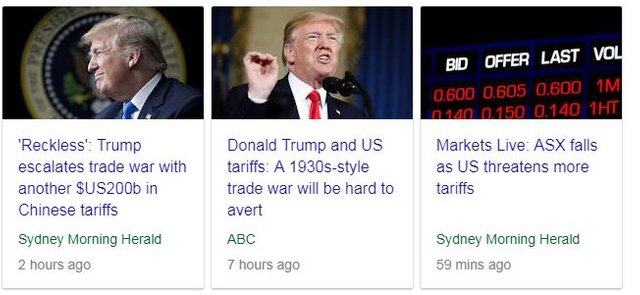
The US said it had no choice but to move forward on the new tariffs after China failed to respond to the administration's concerns over unfair trade practices and Beijing's abuse of American intellectual property
We now head into a 2 month consultation period which will never be good for markets. The signs appeared in S&P futures immediately. Asian session was strongly down. There were a few surprises in Australia with utilities hit worst with a 4% drop. Weird really as utilities normally hold up when markets fall over.
A little more work on understanding oil prices found me this article about the reality of spare capacity being utilized to replace Iranian supply. It seems pretty clear that Saudi Arabia will be hard pressed to extend its production much more than it has already to cover Angolan, Libyan
and Venezuelan shortfalls. It feels like we are stuck with current or higher oil prices for a while yet. That is good news for my portfolios.
https://oilprice.com/Energy/Crude-Oil/Spare-Capacity-The-Biggest-Mystery-In-Oil-Markets.html
World Cup The Google Russia search is about football and the upcoming Putin-Trump summit, now less than a week away.
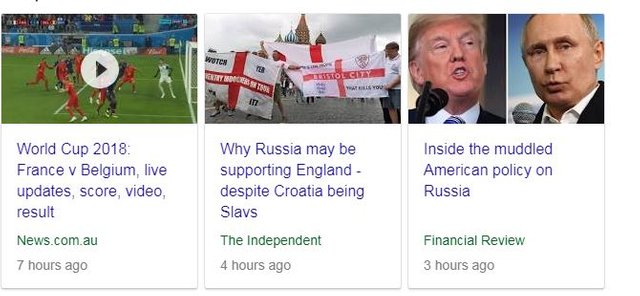
What is clear is there is a lot of confusion on the US side of the upcoming summit
one of the most striking features of the Trump administration: its contradictory and at times incoherent policy towards Russia. Administration officials admit in private conversations that the confusion is the fruit of a clash between a president with a perceived affinity for Mr Putin and the tough line on Moscow that other members of his administration claim they are setting
I watched Donald Trump talking about his upcoming summits - NATO (complicated), UK and Theresa May (complicated) and Vladimir Putin (best of the lot) was what he said. He seems to have lost track of which side he is on. Maybe he is right and Russia is a whole lot less complicated than Western media would have us believe. I am invested in Russia
https://www.afr.com/news/politics/world/inside-the-muddled-american-policy-on-russia-20180710-h12ixy
On the football fields, I did the media blackout and watched the replay of France vs Belgium.
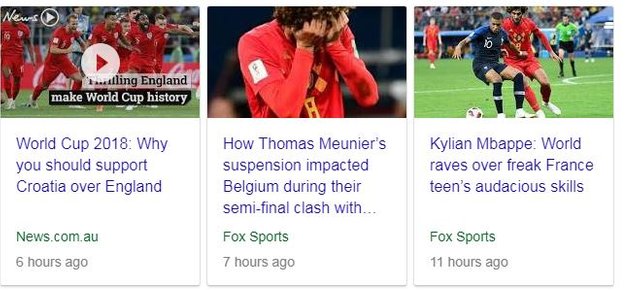
I felt Belgium played better for most of the game but just could not score. Too bad as it was where my $5 bet money was. I will make that up on other Russian investments. Media blackout tomorrow again for me as England relying on Russian support take on Croatia (so says the media)
Bought
Ensco plc (ESV): Offshore Oil Driller. I sold out a stock position in one portfolio on Tuesday. I thought I had holdings in other portfolios - I checked and I did not. My quick review of Ensco vs Transocean yesterday was enough to tell me to get back on the horse (in a different portfolio). Price had run out of the top of the range I had previously bought at which made me a little uncomfortable about the stock purchase again. I looked at options instead. Implied volatility is high which pushed me to look at spreads. I bought a January 2020 7/12 bull call spread for a net premium of $1.54. This offers a 223% maximum profit potential. Closing price was $7.89 meaning the bought call was in-the-money which effectively brings the net premium down to 60 cents.
How does this look on the charts which shows the bought call (7) and 100% profit as blue rays and the sold call (15) as a red ray with the expiry date the dotted green line on the right margin.
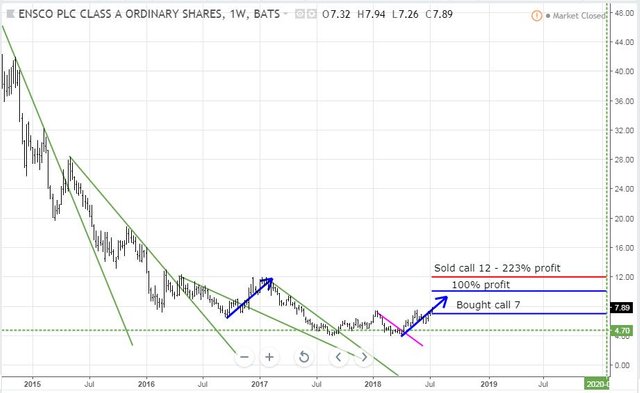
Looking back at prior breaks up, there is one that looks a bit similar to what price has done this time = a break and a small pull back and then break again. If price repeats that (left hand blue arrow), the trade will pass breakeven but will not make 100%. Basically the oil price needs to do more to get to maximum profit. The comfortable part of the chart is the maximum profit level is at the same level as the 2017 highs and the oil price is quite a bit higher.
Now I do have another tweak I can put on the trade to improve the profit profile. I could sell an out-the-money put at a level I would be happy to buy the stock. January 2020 strike 5 put options are trading at $0.65 - this makes this a less than $1 trade and raises profit potential to 461%. If the long run supply constraints continue for oil, I would be very comfortable buying Ensco back at $5 per share compared to the current $7.89
A quick reminder from yesterday's post. Price to Book Valuation for Ensco is 0.38 and debt to equity of 58%. This compares with Transocean (RIG) PB of 0.48 and 73%. Implied volatility for ESV is 56% and for RIG is 48%. Contract sizes for ESV are a little smaller than RIG.
BASF SE (BAS.DE): German Chemicals. I saw the announcement that BASF had reached agreement to build a new chemicals plant in China and would retain 100% ownership. This is an important opening up of what has been a closed but very important market (2nd largest global chemicals market). I am holding December 2018 strike 92 call options which are out-the-money. I bought a December 2020 strike 84 call option which is just out-the-money (€82.44 closing price) for a €7.44 premium (8.8% of strike). I will sell the December 2018 calls to recover some of the premium.
How does this look on the charts which shows the bought call (84), breakeven and 100% profit as blue rays with the expiry date the dotted green line on the right margin?
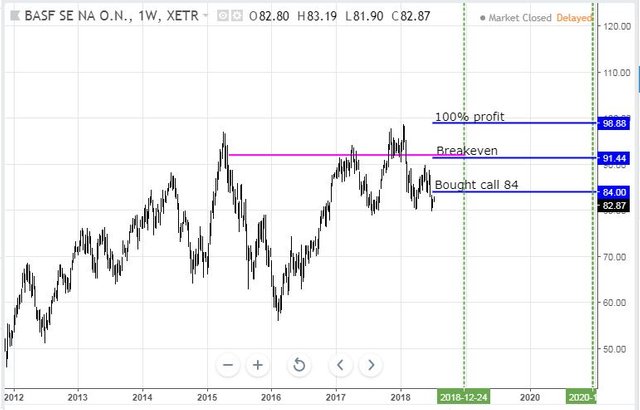
The 100% profit target is just above the early 2018 highs. Price is at the bottom of the range it has been trading in since Q3 of 2017. A run back up like the one from those 2017 lows will get the trade to 100% profit. It would also bring the December 2018 strike 92 calls closer to being in-the-money (the pink ray is the strike) though I fear it will run out of time (the left hand vertical dotted line)
This feels a bit like getting back on a fallen horse. Closed trades in BASF options are showing profits though the open trade is negative right now. What the chart shows is the 92 strike call options trade in May 2015 was not very smart - it was bought at the top and not based on a breakout - it was rolled up from a profitable trade lower down.
There are a few things that need to go right. Economic growth needs to continue. China factory needs to go ahead. Euro must not strengthen against the US Dollar. Chemicals need to be spared from new tariffs.
Shorts
Direxion Daily MSCI Real Est Bear 3X ETF (DRV): US Real Estate. Investing is a game of finding the balance of being right and wrong. One of the ways to work that balance is to use small trade sizes to test out an idea and then to scale in if wrong continues and once right begins. The movement of US interest rates is something that has been wrong for a long time and then right and back to wrong again more recently. The idea of being short real estate investment trusts has maybe been an idea too soon. The chart would suggest that it is not yet right or even totally wrong with price dropping below the resistance level and staying below.
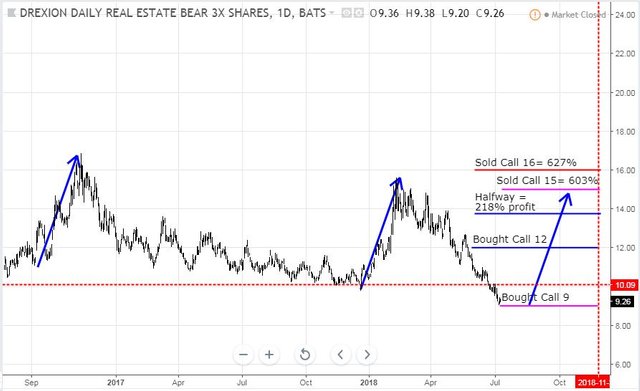
I had another go at scaling in. I bought more stock in one of my portfolios [Note: a reminder that this is an inverse ETF which will go up if real estate yields fall]. I have been holding off in this portfolio buying further bull call spreads - I set up a new one today with the same expiry as before - November 2018 but with a 9/15 spread. This is a little wider than before with a $0.8525 net premium. That offers a 603% maximum profit potential if price can reach or pass the sold strike (15) on or before expiry in November. The chart shows the new trade as pink rays.
I have moved the start of the possible price scenario down to the current level though one cannot say it will start there until we see a reversal in price. If that price scenario plays out the maximum profit could just be achieved for this trade and the other trade will get just past halfway. The encouraging part is the new maximum profit is below the previous highs. This is a leveraged ETF - price will move rapidly when it moves.
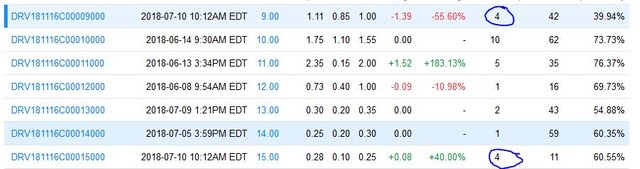
Options chains shows that I was alone on the trade for the day and there is modest open interest - not as liquid as I like but liquid enough. Note also the bought call was $0.31 in-the-money which effectively means the net premium not far off 50 cents.
See TIB235 for the original discussion on using REIT's to short interest rates.
Eurodollar 3 Month Interest Rate Futures (GZ): I am running a fine line on margin in my IG Markets account in which I trade interest rate futures, Japan Govt Bonds and Bitcoin//Ether.
With a sliding Bitcoin price, the account went into negative margin. I closed two open shorts on Eurodollar 2019 futures for small profits (literally $4 or $5 each contract) to release margin. I replaced one of those shorts in morning trade after topping the account up with fresh funds.
The tariffs news is putting pressure on some of the interest rate positions as investors move to safety again.
Cryptocurency
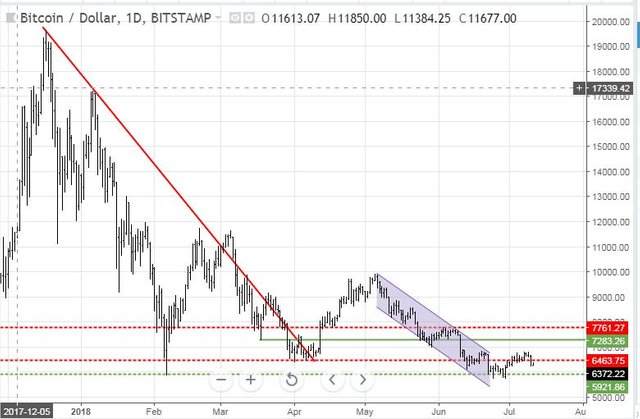
Bitcoin (BTCUSD): Price range for the day was $413 (6.2% of the high). I wrote yesterday that there did not seem to be any committed buyers. I was right with price reversing and closing below the support line it had been respecting.
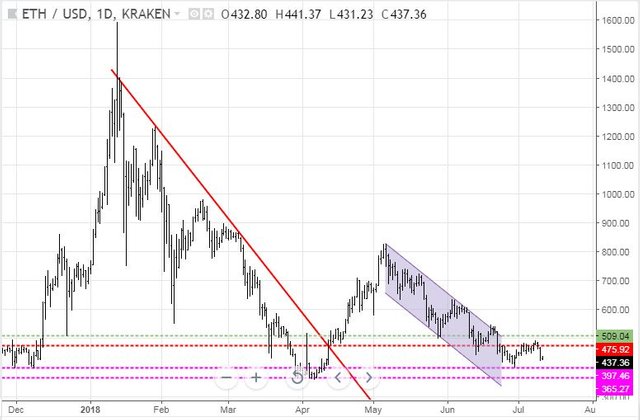
Ethereum (ETHUSD): Price range for the day was $46 (9.7% of the high) for another volatile day. Price continued its move down from the resistance towards the pink support line. It is all very well to be right but I am positioned for price to go the other way.
CryptoBots
Outsourced Bot No closed trades. (213 closed trades). Problem children was unchanged (>10% down) - (18 coins) - ETH, ZEC (-52%), DASH (-54%), LTC, BTS, ICX (-52%), ADA (-49%), PPT (-61%), DGD (-54%), GAS (-64%), SNT, STRAT (-57%), NEO (-60%), ETC, QTUM (-52%), BTG (-62%), XMR, OMG.
ICX joins the 50% down group and BTG remains the worst at -62%.
Profit Trailer Bot 3 closed trades including a stop loss on NEO (-10% at one level of DCA).
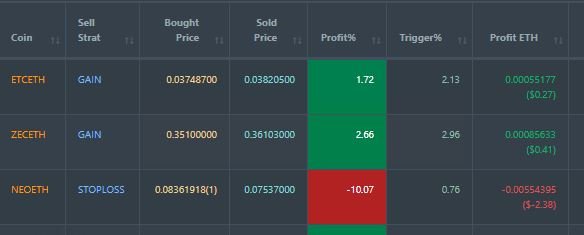
This brings the cumulative position on the account to 0.38% profit (was 0.44%). The idea of switching to the whitelist approach was to avoid bags and pump and dump but also to drive some winning trades. I have taken NEO off the whitelist - it is proving to be a real laggard in all my accounts.
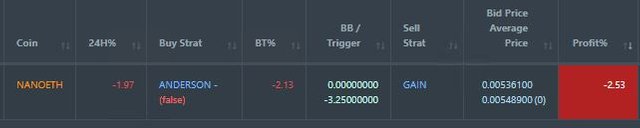
Dollar Cost Average (DCA) list was reduced to one with NEO exiting. NANO has not triggered the first level of DCA which is set at -3.25%. It may not meet the buy volume threshold which is set at 500 coins (currently at 475 only).
I am still testing out the DCA idea - my thinking is to switch it off and to run a tighter stop loss. As you can see from the closed trade list the NEO trade lost $2.38 and the best win was $0.44 - which means I need 6 like that to recover.
Pending list was unchanged at 12 coins with 7 coins trading flat, 2 trading up and only 3 worse. This is unusual on a day when BTC and ETH trade down.
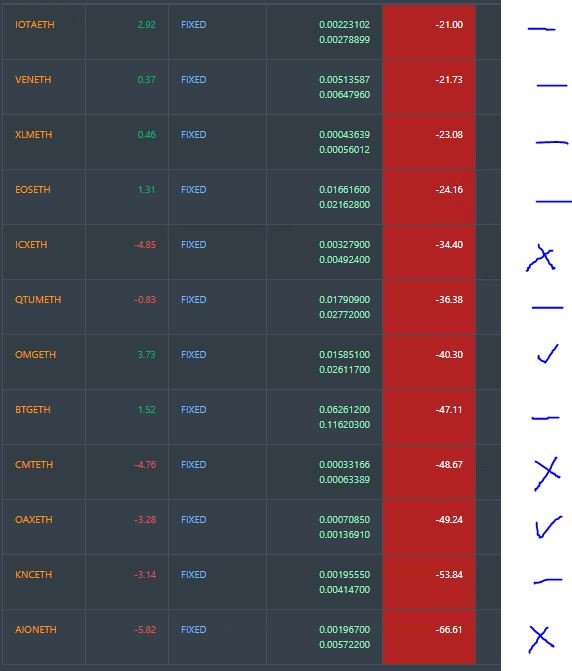
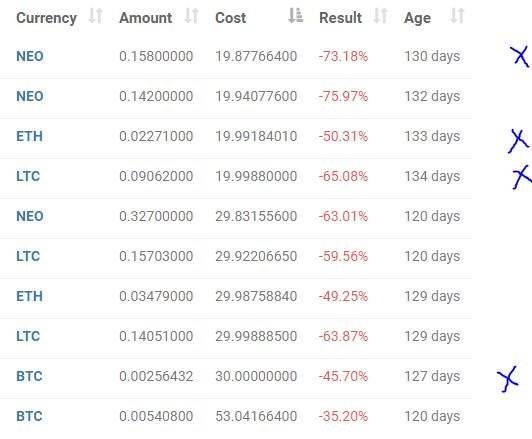
New Trading Bot Positions dropped 2 points to -55.1% (was -53.2%)
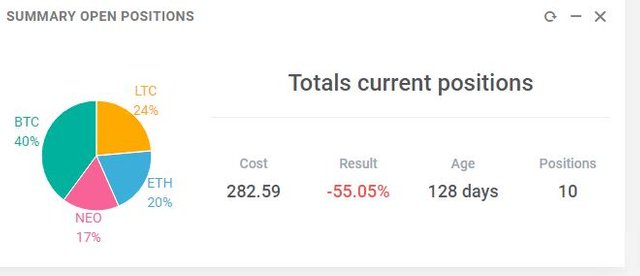
All 4 coins traded worse with NEO touching -75%. I am sure pleased these are small trade sizes as part of the test.
Currency Trades
Forex Robot did not close any trades and is trading at a negative equity level of 2.8% (higher than prior day's 2.7%).
Cautions: This is not financial advice. You need to consider your own financial position and take your own advice before you follow any of my ideas
Images: I own the rights to use and edit the Buy Sell image. News headlines come from Google Search. All other images are created using my various trading and charting platforms. They are all my own work
Tickers: I monitor my portfolios using Yahoo Finance. The ticker symbols used are Yahoo Finance tickers
Charts: http://mymark.mx/TradingView - this is a free charting package. I have a Pro subscription to get access to real time forex prices
Crypto Trading: get 6 months free trades with Bitmex for leveraged crypto trading. http://mymark.mx/Bitmex
Bitcoin: Get started with mining Bitcoin for as little as $25 http://mymark.mx/Galaxy
July 10, 2018
good information for the economy ... even though I am a little less understood
Keep reading and keep watching. A simple Google search every day - US Markets - and read one or two articles. Then search 2 things you do not understand.
thanks for his advice @carrinm ... i will keep searching and learning.
I see in your graph there is a change what happened.market conditions are constantly changing.You should always be full of spirit @carrinm I always support you.
Tariffs bomb changed sentiment
thank you @carrinm I am satisfied and happy with your answer.
thank you for sharing information that is very useful to me, and I will continue to follow @carrinm