TIB: Today I Bought (and Sold) - An Investors Journal #219 - Oil Proudcers, Oil Pipleines, Russia, Health Insurance, Social Media
Federal Reserve goes symmetric and market tizzes. I find opportunities in the oil patch - pipelines and such. I find a backdoor way to grab some healthcare upside?

Portfolio News
Interest Rates The Federal Reserve did what was expected - nothing - but they sent the market into a tizz with the addition of one word (twice) into their statement.
They used the word symmetric in relation to the inflation target. The market seemed to think this means that they will allow inflation to overshoot its target. Is this what they meant? We will find out in due course but it certainly seems clear that we are on track for 3 hikes in 2018 - i.e., two more.
Bill Goss always looks surprised.
Bought
I subscribe to Real Vision as a source of ideas. They ran a review of relative valuations across the sectors following this strong earnings season. Apart from Europe they were struggling to find relative value other than perhaps in oil. This caught my eye:
With everyone crowded into the commodity, the equities appear to be a bit left behind.Looking across the energy complex, from upstream/E&P names to midstream (MLPs, C corps) oil services providers, we note continued production growth in the Permian but widening differentials due to a lack of transport infrastructure, so long positions in a basket of midstream/oil services names in the Permian may be the best way to play further upside from here
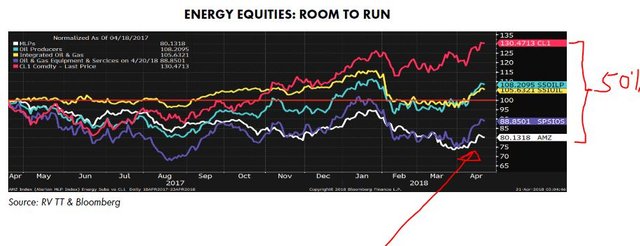
I am already invested in the integrated producers like Chevron and Royal Dutch Shell and also in Oil Services. I have a gap in Midstream Producers (MLP's) and in Pipelines. The challenge is how do you choose? I did find an ETF that tracks Oil Infrastructure - Alerian Oil Infrastructure ETF - ENFR.
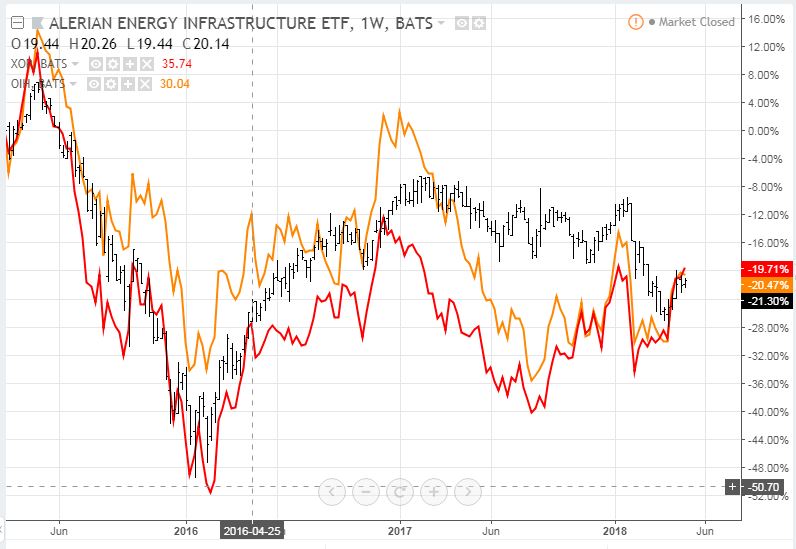
Since the 2014 oil price highs, it has basically performed exactly in line with the Oil Producers ETF (XOP - red line) and the Van Eck Vectors Oil Services ETF (OIH - orange line) though the journey has been different. There is no differential value investing there now. I needed to go down a level and identify some specific stocks.
I present the process I followed in the video below
- Check relative performance against the integrated producers.
- Run a Finviz.com screen for Mid sized and larger businesses involved in both sectors (MLP and Pipelines)
- Focus on companies with better ROI and acceptable debt to equity ratios
- Check the chart patterns
- Check interest cover and exclude those that are not generating enough operating income to cover interest expenses.
- Pick a few and invest a small parcel in each
I picked one oil producer, one mixed producer/pipeline and 3 pipelines.
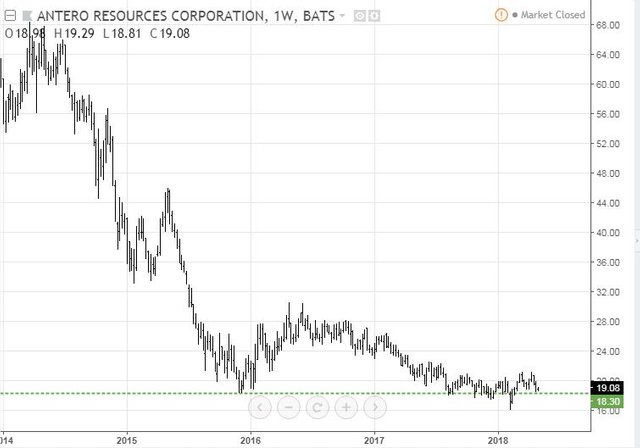
Antero Resources Corporation (AR): US Oil Producer. I liked the shape of the chart - bouncing along off a bottom and waiting for a shot in the arm. It reminded me of the Whiting Petroleum (WLL) chart a few months ago
Boardwalk Pipeline Partners, LP (BWP): US Oil Pipelines
Centennial Resource Development, Inc (CDEV): US Oil Producer and Pipelines
Enable Midstream Partners, LP (ENBL): US Oil Pipelines
Shell Midstream Partners, LP (SHLX): US Oil Pipelines. More risk here as this covers Gulf of Mexico pipelines as well.
Van Eck Vectors Russia Small-Cap ETF (RSXJ): Russia. Russian stocks have been beaten back with the new US sanctions imposed. Russia is a major beneficiary of oil price rises. I added to my holding to average down my entry price - it is disappointing to see politics getting in the way of good investing ideas.
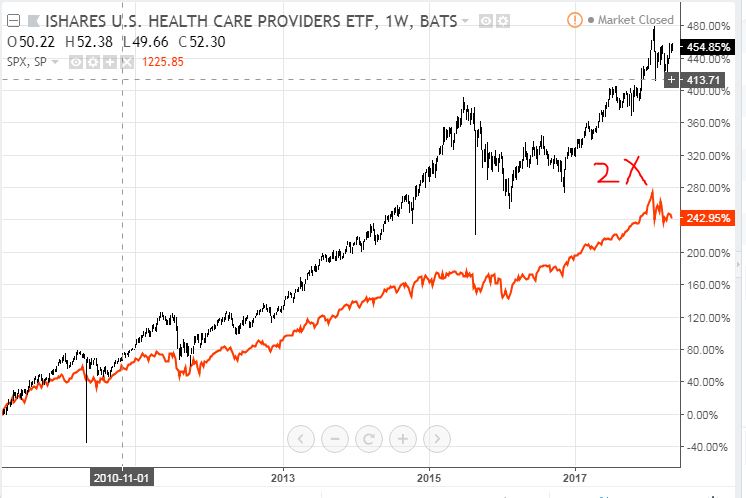
Unum Group (UNM): US Healthcare. Unum announced results that disappointed the market and share price was knocked back 15%. Healthcare has been a strong driver of US market performance since the GFC - in fact the sector (using iShares US Health Care ETF - IHF - black bars) has almost performed twice what the S&P 500 (orange line) has.
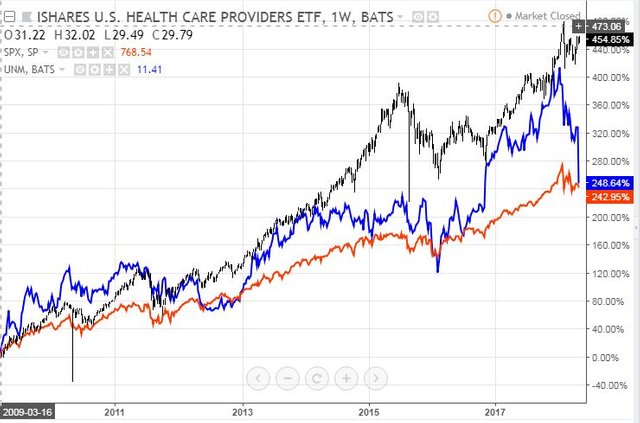
The US Election and the demise of the Affordable Care Act made a dent in the investments I had made. So I have been a little gun shy - market was over-extended and prone to political intervention. I have been itching to get back - here was a discount opportunity. The next chart shows Unum (blue line) basically performing in line with the sector but then falling back to the S&P 500 level - close half the gap to the sector and this is a solid trade idea.
Transocean Ltd (RIG): US Offshore Oil Driller. I was looking at income trades for Transocean. With the discussion about oil opportunities in my mind, I felt that I could get caught out being short in the short term. So I added a 45 day to expiry strike 12 call option (closing price was $11.97) on a hunch. Looking at a chart shows that this is not hunch - it might be experience talking. The chart shows my last contract with blue rays.
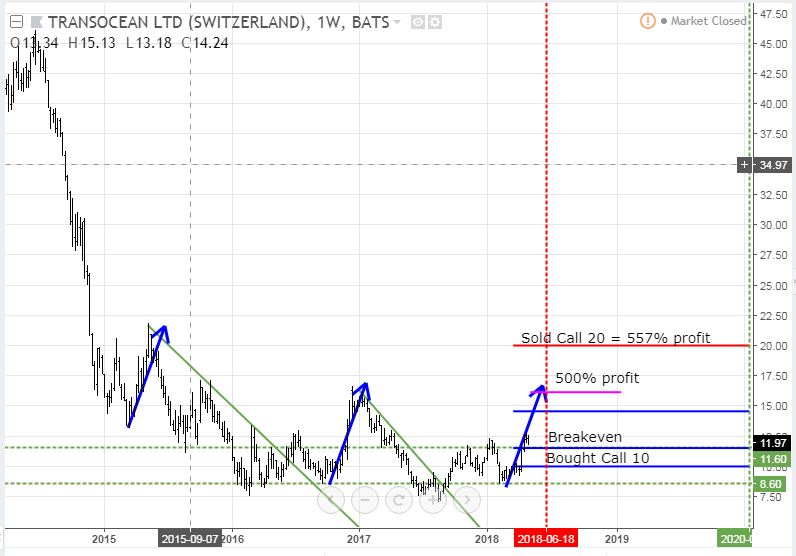
Nothing else has changed other than new price data - same blue arrows. I have put in a red dotted vertical line for the close in expiry and a pink ray which matches the top of the right hand blue arrow. If price keeps doing what it has been doing on the past patterns, the new trade will make 500% before expiry on June 15 (my mother's 94th birthday)
ENGIE SA (ENGI.PA): French Utility. Price has moved past the strike 14 call options I bought a month ago. I added the next strike in a staircase of options with a December 2020 strike 16 call option. Why? With markets starting to reach full value, utility stocks start becoming interesting. With premium of €0.90 this was cheap to me (5.6% to strike and 6.2% to close). How does this look on the charts? The chart shows the two sets of contracts (strike 14 as blue rays and strike 16 as pink rays) with expiry the dotted green line on the right margin.
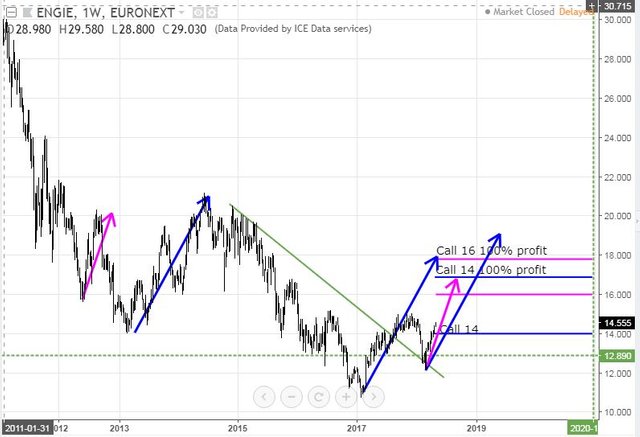
I have modeled the last run up from a bottom (left hand blue arrow) and copied it across to the recent lows. Price has not repeated that pattern from the most recent bottom. If it does repeat it from the intermediate low (the right hand blue arrow) both trades will hit 100% profit. If price just repeats a pink arrow run only the strike 14 calls will make 100%. But there is time for two pink arrow runs to get both to 100%.
The smart chart observers will see that the new option was cheaper than the last one (viz, gap between call line and 100% profit is smaller)
Snap Inc (SNAP): Social Media. I do not often buy stocks in extended hours trade other than to capture over-reactions. Well the market decided in the cold light of the night that a drop of 15% in Snapchat was not enough. They added another 5% in regular trade to make a 20% drop. I added another position to get down to where the market wanted to start over again. See TIB218 for the SNAP story
Income Trades
Two more income trades hit their bids overnight. With only two weeks to go to expiry, the net premiums were solid.
Fluor Corporation (FLR): US OIL Services. Sold May 2018 strike 62 calls for 0.80% premium (1.03% to purchase price). Closing price $58.95 (higher than last month). Price needs to move another 5.2% to reach the sold strike (easier than last month). Should price pass the sold strike I book a 16% capital gain. Income to date amounts to 4.4% of purchase cost.
BHP Billiton Limited (BHP): Australian Mining. Sold May 2018 strike 49 calls for 0.80% premium (0.70% to purchase price). Closing price $46.30 (higher than last month). Price needs to move another 5.8% to reach the sold strike (easier than last month). Should price pass the sold strike I book a 56% capital gain. Income to date amounts to 3.3% of purchase cost.
Cryptocurency
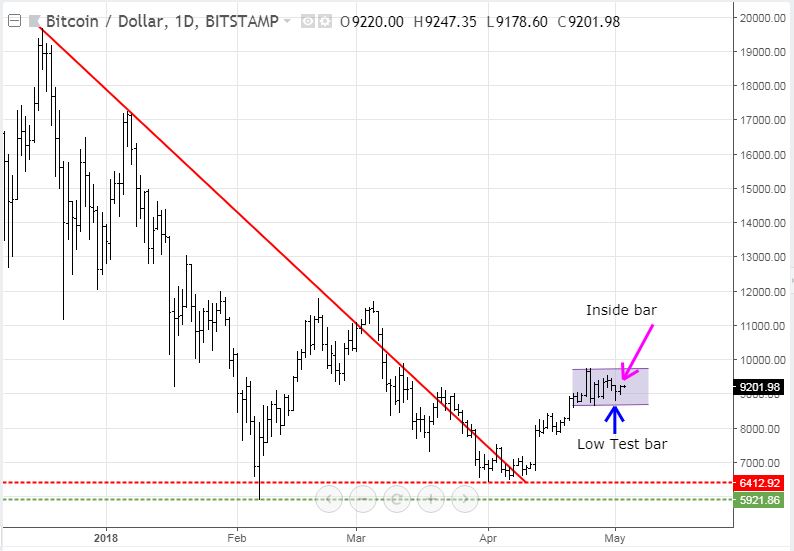
Bitcoin (BTCUSD): Price range for the day was $284 (3.1% of the high) making for a very quiet day. Altcoins had a strong day on the back of this inside bar day. [Means: Price was fully contained by the high and low of the previous day]. This should be a happy place for traders
CryptoBots
Outsourced Bot Bot closed two trades on ADA (1.78%) and XRP (1.83%) for 188 closed trades in total. Problem children (>10% down) list was unchanged - ETH, ZEC, DASH, ENG, GAS, NEO, ETC, STRAT, BTG (9 coins). The bot is fully invested and needs to close some trades before it can open new ones.
Profit Trailer Bot Overall the bot closed 4 trades for an average profit of 1.32% bringing overall loss on 202 closed trades to -0.74% of total balance. Of note is that EOS recovered from 3 levels of DCA - the upside of DCA when it works. The bot does struggle to find replacement trades when markets are rising.
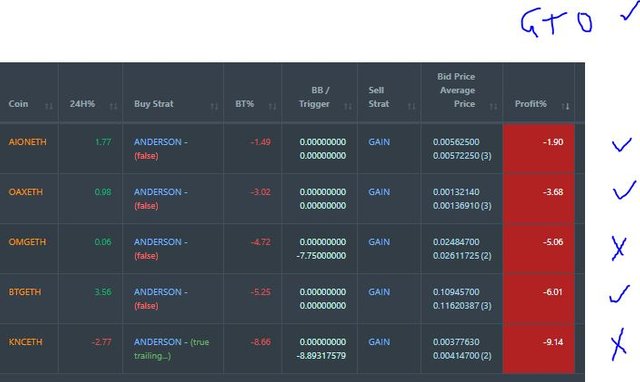
Dollar Cost Average (DCA) list was reduced by one with GTO making it to profit. Of the 5 left on the list 2 did worse and 3 did better. Only KNC went down on the day overall (red number in 24H column).
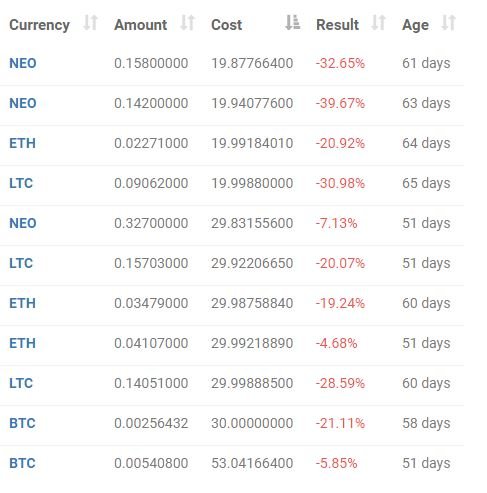
New Trading Bot Overall trade positions are down 19% (was 21%).
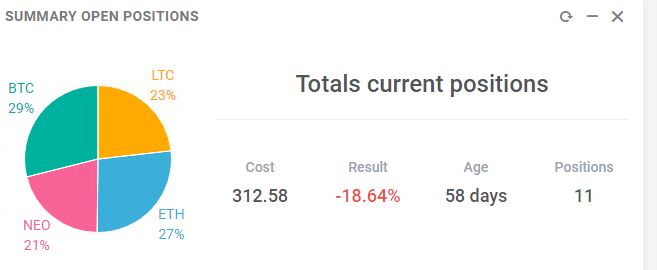
All positions improved on the day with one trade dropping below 5% loss levels - I will close those manually at breakeven
Currency Trades
Forex Robot did not close any trades and is trading at a negative equity level of 18.4% (lower than prior day's 21.3%).
Cautions: This is not financial advice. You need to consider your own financial position and take your own advice before you follow any of my ideas
Images: I own the rights to use and edit the Buy Sell image. News headlines come from Google Search. Bill Goss image comes from Bloomberg.com. Real Vision image is credited below the image. All other images are created using my various trading and charting platforms. They are all my own work
Tickers: I monitor my portfolios using Yahoo Finance. The ticker symbols used are Yahoo Finance tickers
Charts: http://mymark.mx/TradingView - this is a free charting package. I have a Pro subscription to get access to real time forex prices
Bitcoin: Get started with mining Bitcoin for as little as $25 http://mymark.mx/Galaxy
May 2, 2018
Upvoted ($0.13) and resteemed by @investorsclub
Join the Investors Club if you are interested in investing.
I am long on Oil Pipelines as well. They saw a huge dip at the beginning of the year, and I was able to buy up a ton on sale!
I was buying oil services then. I missed the pipelines that time. That is OK as I prefer to see things that have confirmed the reversal. Your comment does remind me of the challenges of being a solo investor - where to find ideas and to find time to do the research?