TIB: Today I Bought (and Sold) - An Investors Journal #194 - Steel, Aluminium, US Financials, Europe, Japan Electronics, Interest Rates, Bitcoin, Altcoins
Tariffs arrive on aluminium. Changing teams in steel with a 10 bagger paying for it all. Profiting in US Financials and crypto bot trading is working a treat.
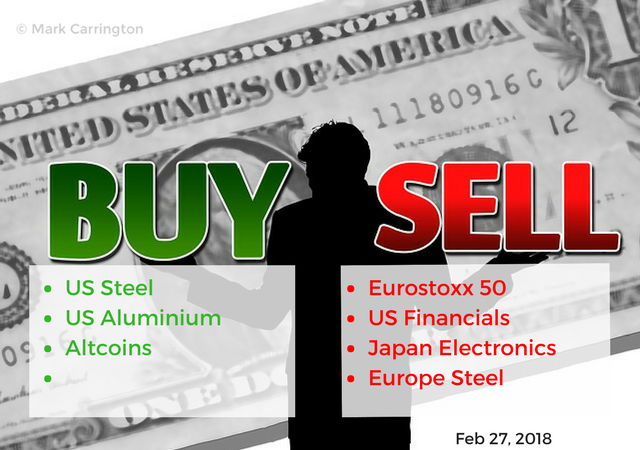
Portfolio News
Interest Rates Jay Powell, Governor of the Federal Reserve presented 3 hours of testimony in Congress which painted a strong picture for the US economy.
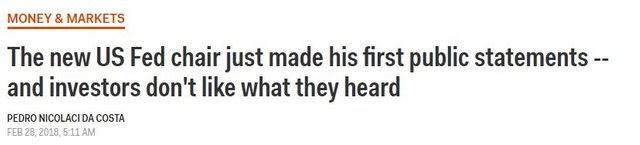
You would think that markets would like the story BUT they were listening to another tune. It is the old tune about Federal Reserve squeezing the life out of an economy by moving too fast with rate hikes. The sad part of the old tune is it is more than 10 years old. I like to think that the Federal Reserve, which has been prone to making mistakes, does not make the same mistake twice.
https://www.businessinsider.com.au/fed-chair-powell-hints-at-more-rate-hikes-stocks-sell-off-2018-2
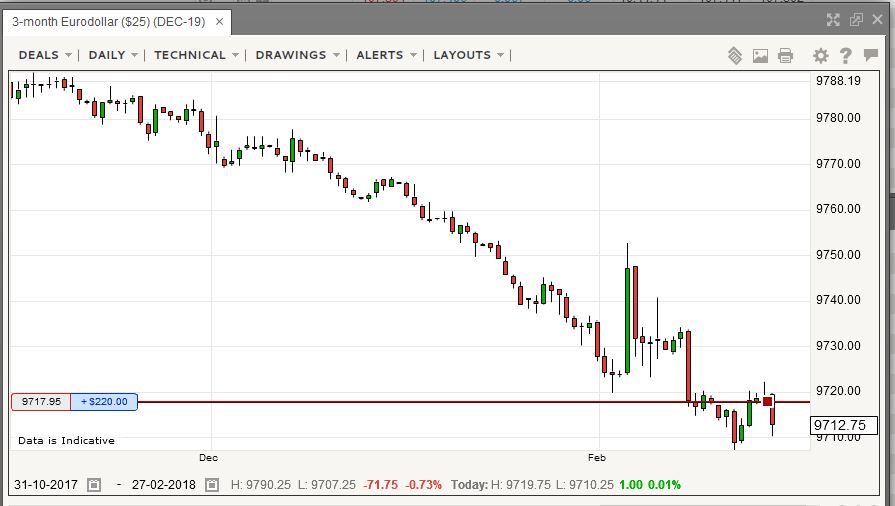
So it seems that I was right on my short interest rates call - here is the chart which shows the market go back to pricing in one more rate hike.
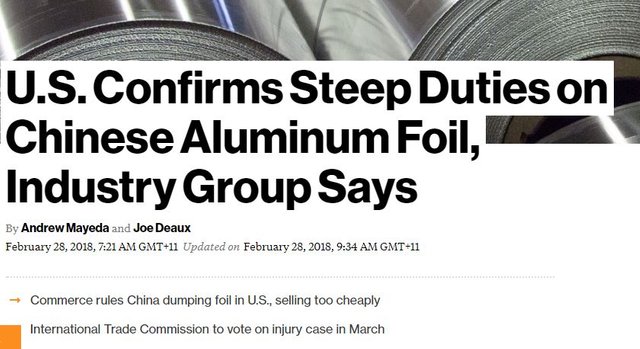
Tariffs The next round in the tariffs saga went across the bows yesterday with US Commerce Department ruling that China is dumping aluminium foil and imposing a range of tariffs between 49 and 106%. There are still some detailed steps to be completed before the tariffs actually apply - but the game is on.
I promised that I would review the US Steel industry overnight. I will go through the steps I followed to make my investing choices.
Step one was to review the compontnts of the steel Industry ETF (SLX) to identify the US producers in the ETF. Here is the list of top 15 holdings.
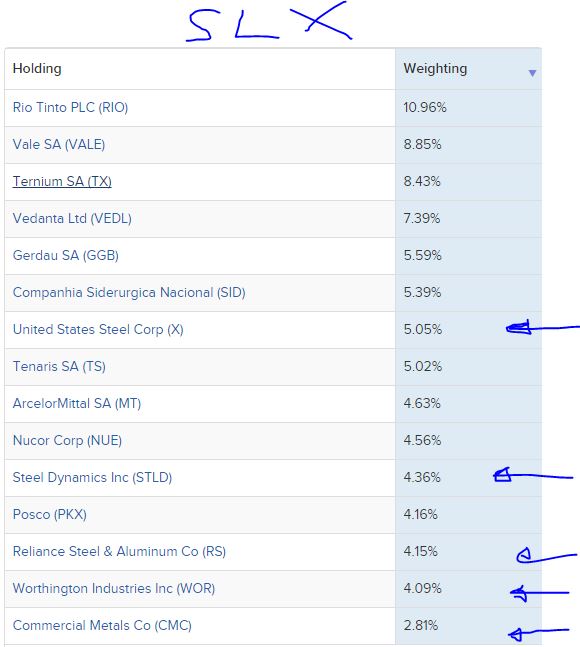
A few things stand out:
- Top 2 holdings are iron ore producers
- Next 25% of holdings are foreign steel producers
- Not a lot of US steel in the index with US Steel (X) the highest.
This tells me that my instinct purchase of SLX was not right - not enough US steel in it. I will dump that when I can escape comfortably.
Step 2 was to identify which of the US producers have options going out to January 2020. That left US Steel (X), Steel Dynamics (STLD), Allegheny Technology (ATI) and AK Steel (AKS). I added in ATI and AKS from page two of the holdings.
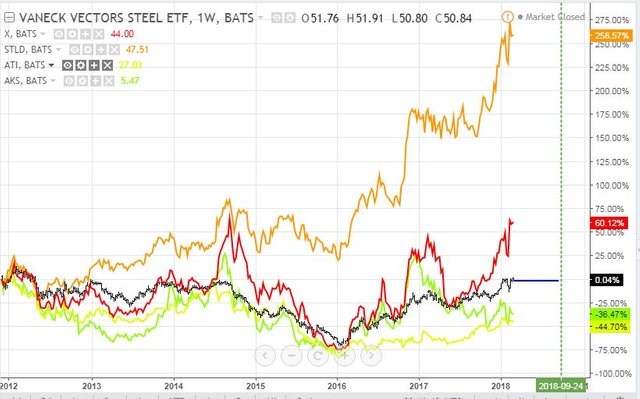
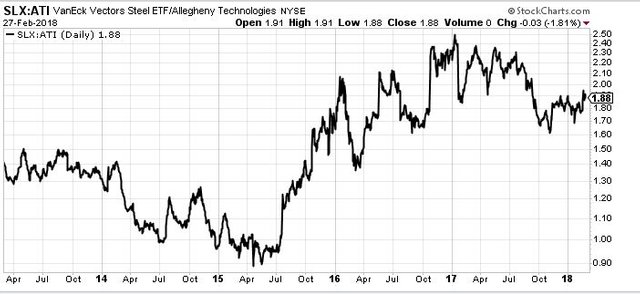
Step 3 was to map these against SLX (black bars) to see which the relative underperformers are. I did this with relative comparison charts and also with buy:sell charts. Steel Dynamcis (STLD - orange line) and US Steel (X - red line) are clearly outperforming since the 2012 lows. Allegheny (yellow line - ATI) and AK Steel Holdings (AKS - green line) are underperforming.
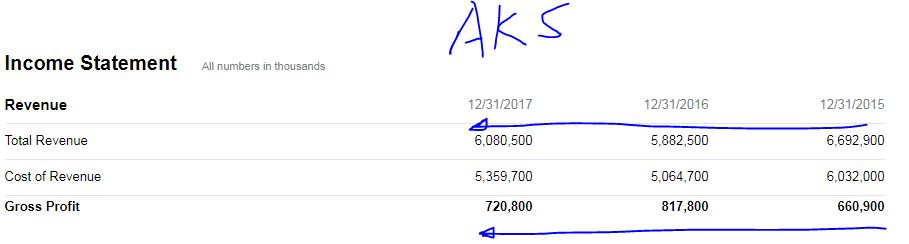
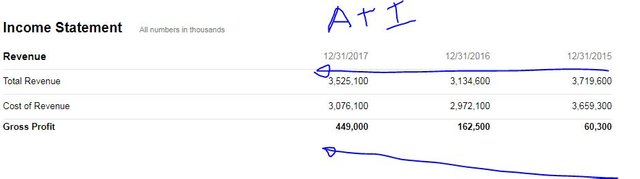
Step 4 was to review financials to understand how the profitability profile would change with price protection that comes from an imposed tariff. Both AKS and ATI are showing level revenues for the last 3 or 4 years and steady or improving profitability as they cut costs. Change the revenue line by taking out cheap foreign imports and that must flow to even better earnings.
Step 5 was to review the option chains to identify possible option plays to add to outright stock purchases.
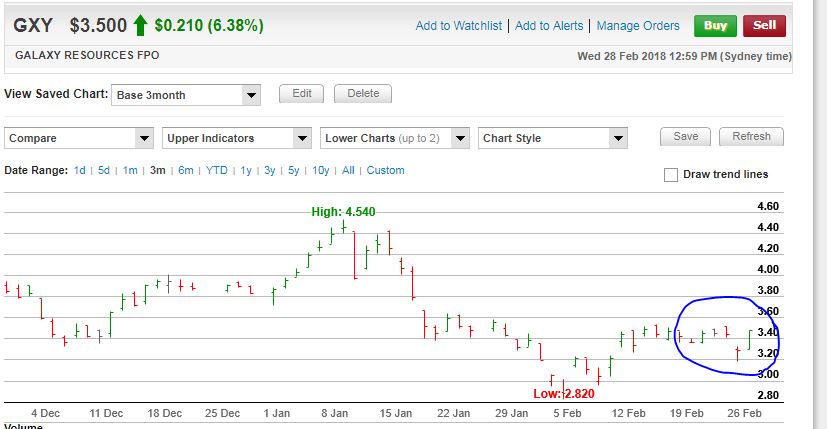
Lithium I hope you grabbed your Lithium discounts thanks to Morgan Stanley. Somebody did in Galaxy Resources (GXY.AX) which I hold in my portfolio (inside the blue circle). There is still some way to go to the highs from January.
Bought
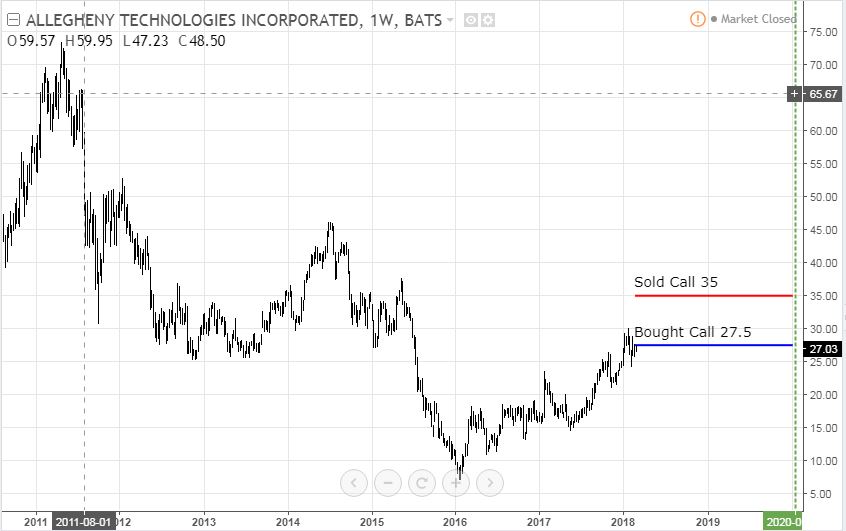
Allegheny Technologies Inc (ATI): US Steel. I added ATI to the steel list as it is partly involved in the steel industry. It is also involved in speciality metals (like titanium) and I have had good success in that sector via Osaka Titanium (5726.TK).
The buy:sell chart shows that Allegheny turned over in mid 2017. I am expecting that tariff protection will halt the sideways move in this chart.
Bought stock and a 27.5/35 bull call spread. The bought call is just out-the-money. Implied volatility on steel stocks is high - hence looking to buy a spread. The net premium was $2.71 which gives maximum profit potential of 176%. The chart shows that the sold call is well below 2015 highs - all the business has to do is keep doing what it has been doing.
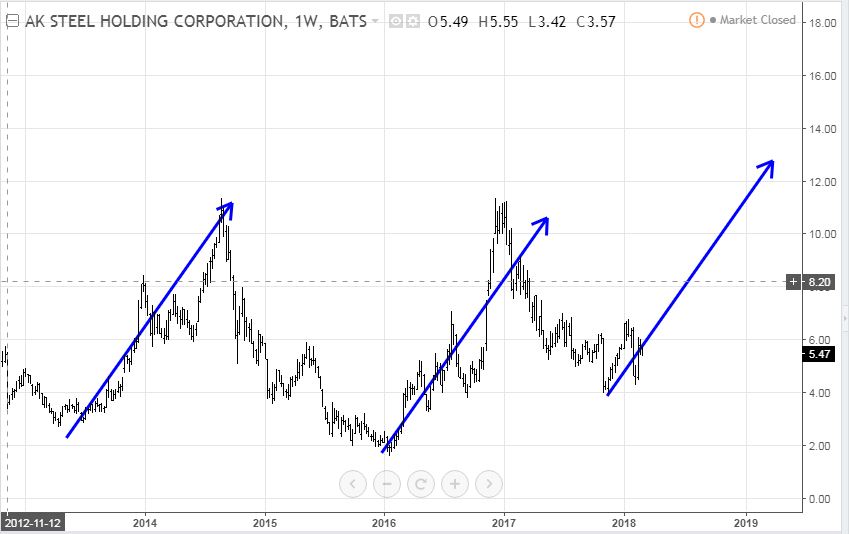
AK Steel Holding Corp (AKS): US Steel. AKS is a more traditional steel maker operating in Pennsylvania. I have had good success trading it in the past. The buy:sell chart is more compelling as it has not really turned over yet. Any tariffs will definitely help here.
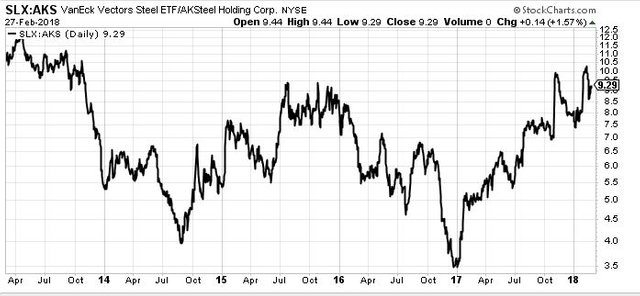
Bought stock and a 4/7 bull call spread. The bought call is well in-the-money and the sold call was the highest I could find. Net premium was $1.52 which gives a maximum profit potential of 97%. This is a bit lower than I like but it is what was available - doing a 5/7 spread was not working for me. Now looking at a chart suggests to me that I may have been too cute - just buy the stock and look for another of those runs or buy the furthest out-the-money call (strike 7) as 100% profit is well below recent highs.
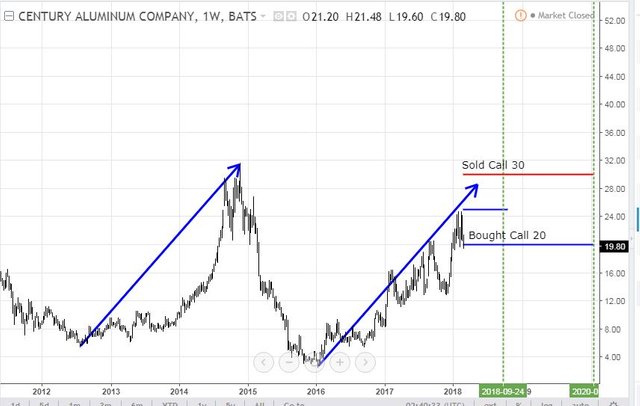
Century Aluminum Company (CENX): US Aluminium. I had put in a bid before market open on a January 2020 20/30 bull call spread. I was hit for $3 net premium which gives a maximum profit potential of 233% if price reaches $30 on or before expiry. The chart shows that this is within the last highs in 2014 and momentum is looking good. Tariffs imposed on aluminium foil will help.
Sold
My broker (Interactive Brokers) increased margin requirements which was restricting my ability to place new trades on one account. I made some sales across accounts to release funds for new ideas.
Comstage DJ EuroSTOXX 50 ETF (CBSX5E.SW): Europe Index. Sold half my holding to bank some profits. With a SFr 55.95 average cost bought in July 2011, Sept 2012 and December 2012, I gained 45% profits. Given those positions were bought in the midst of the European Debt Crisis, a good outcome.
Bank of America Corp (BAC): US Bank. Sold 30.79 strike call warrants for 552% profit since June 2015. These warrants were issued as part of the TARP program when the US Government bailed out the banks after the GFC. At the time nobody believed that price would pass the very high strike price - it did and has been holding above for a few weeks now. Thanks to my investing coach for finding these at the time. I remain exposed to Bank of America through stock holdings and January 2020 bull call spreads.
Sony Corporation (SNE): Japan Electronics. 50% profit from stock obtained from exercised options in January 2017.
Financial Select Sector SPDR ETF (XLF): US Financials. I have been holding a mini-staircase of options in one account. I sold January 2019 strike 25 call options for 177% profit since December 2016. I am holding out-the-money options with January 2020 expiry.
ArcelorMittal (MT.AS): Europe Steel. Sold strike 23.25 call options for 1018% profit since July 2016. With the risk of US steel tariffs, it was time to take some profits off the table.
Cryptocurency
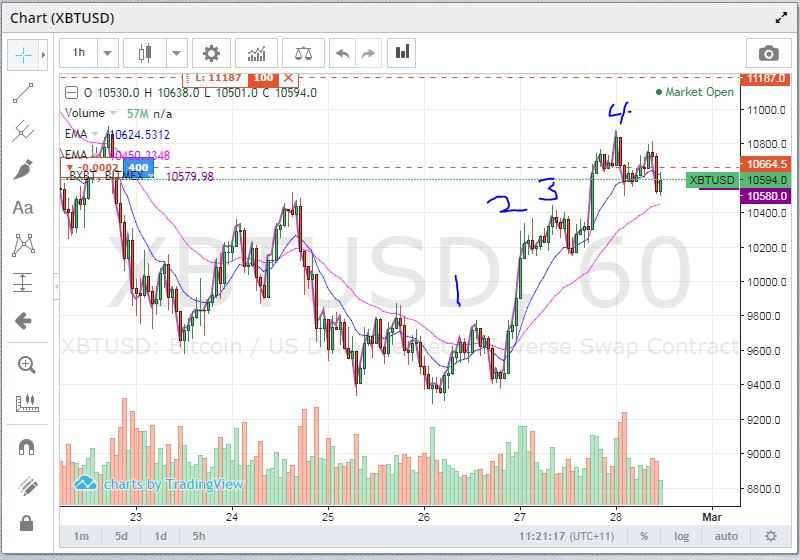
Bitcoin (BTCUSD): Price range for the day was $700 (6.5% of the high) which is lower than average (I use 7% as my guideline) with price quietly working its way ahead to make 4 higher highs on a 1 hour chart. In my Bitmex account, one contract hit a profit target and this morning I closed out one more contract on the lower low signal after the 4th high. Average profit was $688 per contract (6.9%)
CryptoBots
Outsourced Bot closed two trades for 1.25% profit each on NEO and ARK. The summary report is a bit confusing as it shows the USD amounts going up but the percentages reported going down. I have noted the prior percentages on the image.
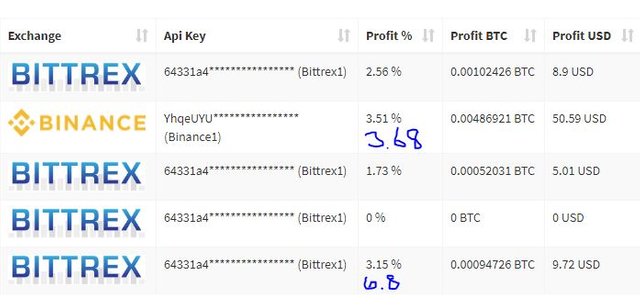
For reporting of crypto trades one has to decide whether to report in base coin (BTC for this robot) or in a fiat currecny (USD). This bot uses fiat as the base. Trades were made but BTC went up relative to USD - hence reporting lower numbers. Problem children list is one shorter now but still contains ZEC, DASH, ETH, ENG, EOS, GAS, and STRAT.
Finding ways to avoid pump and dump coins and problem coins is a key part of robot trading. I am still working that side out.
Profit Trailer Bot My own trading robot closed 12 trades for an average profit of 1.70% bringing the overall average up to 1.56%. Here is the top 10.
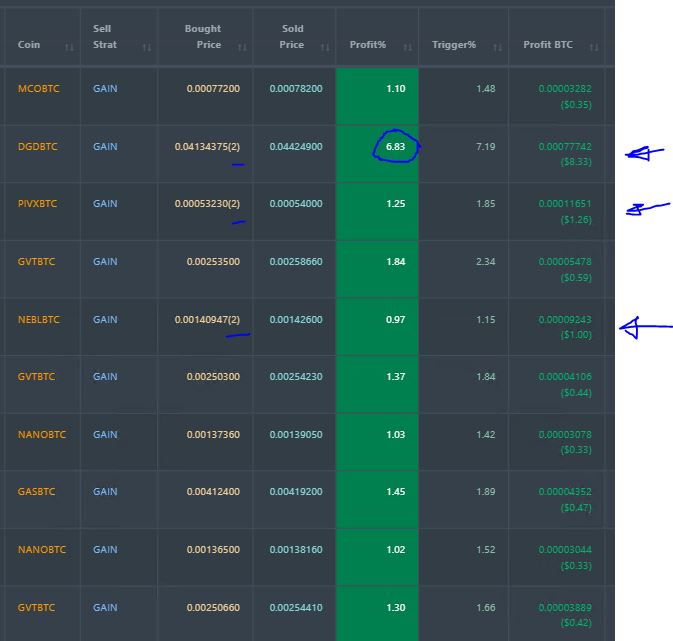
I have highlighted 3 that came from Dollar Cost Averaging (DCA) each with two buys. The leading win at 6.83% (DGD) came from DCA. I will be building out this side of the robot strategy.
The DCA list is shorter by 2 down to 8. I cut the buying levels back to 2 while BTC was rising hard yesterday.
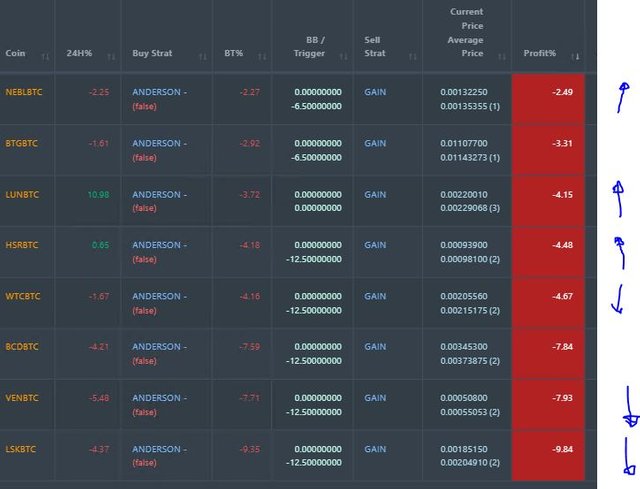
I have marked the risers and fallers - new entrants are blank (BTG, BCD). I am encouraged to see yesterday's worst perfomer (LUN) quietly rising up the list to -4.15%. There is still some way to go to be out the woods on this.
New Trading Bot Working on a new tradng bot brings surprises. I made a change and was surprised to see a whole bunch of duplicate trades open up. I closed them all out around the 1% profit mark to leave the bot trading one open position at a time. Average profit for 21 (17 new) closed trades thus far is 1.6% for not quite two days work. That is a good start.
Currency Trades
Australian Dollar (AUDUSD): Long dated 0.7000 strike put options expired worthless. These trades were put in place predicated on US Dollar strength two years ago and topped up more recently. The chart tells the story with the trend quite clearly down at the time the trade was first opened in February 2016. Price reversed at the time the trade was set up and has been nowhere since.
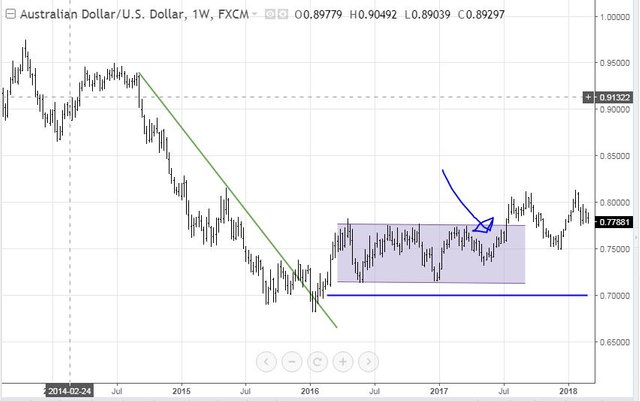
Overall loss was $1196 for the longer term trade and $280 for the shorter term trade. The trade was not a complete loss as I did set it up originally as a bear put spread selling a put even lower. I bought that put back at a good profit some time ago. The big lesson on this trade was to close it out for a smaller loss when price broke out of the band it traded in during 2017.
Forex Robot did not close any trades and is trading at a negative equity level of 9.7% (higher than prior day's 10.04%).
Outsourced MAM account I run an outsourced forex trading account with Actions to Wealth. They closed out 2 trades for 0.7% loss for the day.
Cautions: This is not financial advice. You need to consider your own financial position and take your own advice before you follow any of my ideas
Images: I own the rights to use and edit the Buy Sell image. News headlines come from Bloomberg.com and Business Insider. All other images are created using my various trading and charting platforms. They are all my own work
Tickers: I monitor my portfolios using Yahoo Finance. The ticker symbols used are Yahoo Finance tickers
Charts: http://mymark.mx/TradingView - this is a free charting package. I have a Pro subscription to get access to real time forex prices
Crypto Trading: get 6 months free trades with Bitmex for leveraged crypto trading. http://mymark.mx/Bitmex
February 27, 2018
Hi, great post, worth a follow.
Thanks
thank you for sharing your friends, @carrinm, hopefully successful friends in business, @ jhoni always support.
As a conventional trader in a traditional market, I'm confused to read your post, even though the charts you provide are interesting, reminding me of past school lessons. Sorry for this stupid comment.
This sort of comment is totally useless and gratuitous. Be more specific so I can learn how to write better or explain better. .
Great detail on these trades.