Simple Technical Analysis of Inverse Head and Shoulders Pattern with Practical Examples
.png)
Background Image Source- Canva.com/Location

Assalam-o-Alaikum Steemians !
I'm @moneyster, a professional level Cryptocurrency investor and an analyzer. As usual, today I thought to share another Crypto-related experience with you. I hope this article will be considerably beneficial for all the Steemians in this community
.gif)
 |
|---|
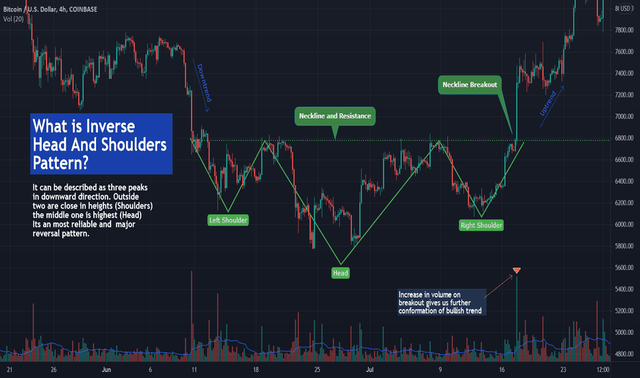
Inverse Head and Shoulders Pattern is a very reliable pattern as compared to other basic chart patterns such as Bullish engulfing, Piercing line, and Morning star candlestick patterns. With the help of this Inverse Head and Shoulders Pattern, we have the ability to take long positions or buy new assets after confirming the entry through the neckline of this Inverse Head and Shoulders Pattern.
This Inverse Head and Shoulders Pattern is not common in the price chart if we use higher time frames to analyze our charts. Because this chart pattern is quite advanced as compared to other basic candlestick patterns. However, if we are able to find Inverse Head and Shoulders Pattern in the chart with higher time frames such as 4H and 1D charts, we have a higher possibility to win the Trade as a lot of professional Traders are focusing on those specific patterns to make their entries.
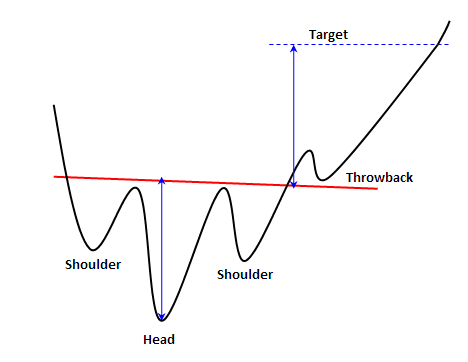
The appearance of this Inverse Head and Shoulders Pattern is quite similar to the basic structure of the human head and shoulders. That's why this pattern is also known as the Head and Shoulders Pattern and the reverse side of that pattern is known as Inverse Head and Shoulders Pattern which I have already mentioned as the lesson for today.
To take possible entries with this Inverse Head and Shoulders Pattern, we should wait until the price chart breaks the neckline with a considerable trading volume. Then, we can focus on an attainable retest for the breakout. After that, we can easily take our entry when the next candle breaks the previous candle which is formed as a bullish candle in this neckline.
Here we can use the bottom or lower wick of the right shoulder to set our Stop-Loss and the lower wick of the bottom head can be used as a confirmed stop-loss point to exit from the position. At the same time, we can use the distance between the upper wick of the shoulder and the lower wick of the head as the target point to take profit.
As I said before, the Inverse Head and Shoulders Pattern is a very reliable chart pattern that we can use to take long entries in the market during a significant bear market. The most interesting thing about this Inverse Head and Shoulders Pattern is that the risk-to-reward ratio of this chart pattern is very advantageous. With the help of this Inverse Head and Shoulders Pattern, we can get better rewards with relatively low risk. This chart pattern is very unique and can recoginze very easily as the pattern looks simmilier to the human structure.
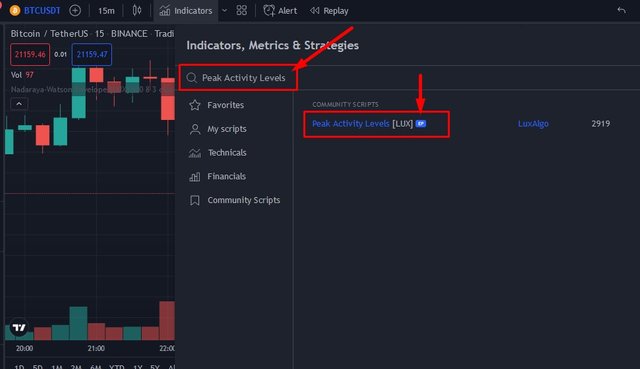
First of all, I will add this Peak Activity Level indicator to my Crypto Chart using the TradingView platform. Then we can go to "Indicators" through the tool panels and search "Peak Activity Level" in the giver search bar. Below I have included a screenshot to demonstrate adding the Peak Activity Level Indicator to our chart.
 |
|---|
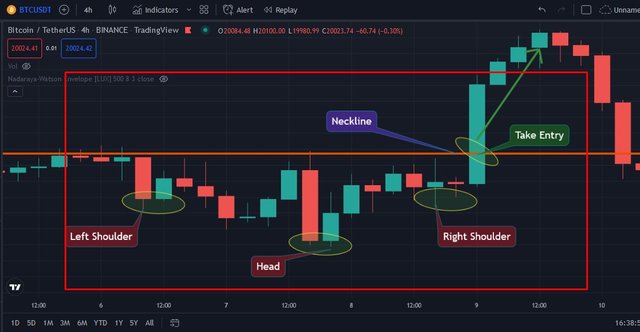
First of all, I will open BTC/USDT chart using the TradingView platform. Then we need to find the proper Inverse Head and Shoulders Pattern using the candlestick chart which consists of the structure of the human head and shoulders.
Here the price level should break the neckline of the Inverse Head and Shoulders Pattern to take our entries. If possible, we should wait for a good retest for the broken point. I will further demonstrate it through the BTC/USDT chart.
Below I have demonstrated the Inverse Head and Shoulders Pattern as a result of a buy setup. Here we can see there is a Inverse Head and Shoulders Pattern and a proper bullish candle that have been traded following the exact buy setup. Then we can take our buy entry with the help of this trading setup. At the same time, we will be able to set the stop loss point by using the Lower wick of the right shoulder of the Inverse Head and Shoulders Pattern.
 |
|---|
In this way, we can easily use this Inverse Head and Shoulders Pattern in the chart and take more accessible trading opportunities. However, we can try to combine this strategy with some other indicators to increase the winning percentage.
At the same time, as I said in my previous article, we should remember that all the indicators and strategies are not efficient completely as nothing we can find 100% efficient in the world. So, we should depend only on these strategies and indicators to confirm our trading opportunities.
I have studied the below-sourced articles to study these topics further, and I have explained all the above facts in my own words and experience.
10% benificiary set for @tron-fan-club
Twitter Shared
https://twitter.com/moneyster12/status/1542187585337966592?s=20&t=ublT4HSYTwgZSnQ95GPn-w
You have illustrated this point in many beautiful ways through examples. You have written very beautifully.
Thank you very much for the inspirational comment on my article. It really encourages me to write more related articles in this community.
Brilliant work my friend
Thank you very much for the response my brother. It means a lot to me.
Es importante que a las captures de pantalla, como por ejemplo en Tradingview, colocar una marca de gua con tu nombre de usuario.
@pelon53
Thank you very much for your cooperation @pelon53. Of course, I will definitely follow your guidance. I think it is better to follow your method.
My dear friend @moneyster. It's great learning another interesting lesson form you once again. Don't forget you're one of the authors and teacher I love learning from in this platform. Keep dishing out value.
It's a pleasure to see your detailed comment on my article. Thank you very much for your appreciation and I know you are another valuable teacher in this community.
You're welcome dear friend.
You've shared a great post my friend, it amazing to learn about TA from this wonderful community
Thanks a lot for your best feedback. I really appreciate it.
It great content and it's well appreciated
Thank you very much for your valuable feedback. I really apprciate it.
Nice article you've published here⭐
Thank you very much for your valuable comment on my article.
Hello friend,
It is rare to come across such an educative post as yours, I can bet that you spent quality time to prepare this post.
Thank you very much for this quality post, I hope to see more of this post as I visit your blog.
#steem-on 💙
Thank you very much for visiting my articles every day. It means a lot to me. Stay with me to read more related content.