Moving Charts: TRX Value Per Coin Analysis | 10% To @tron-fan-club
Hello and welcome to everyone at the Tron fan club. Today we take a look at TRX and its price movements. Very recently the market has been relatively stable and is actually gaining some pace. Trx has been following the mass trend and the result is reflected in the chart. And as usual, we start from a week ago.

Made with Canva.
The week started as TRX went up to 0.0768$ from 0.0761$ swiftly. But soon it became a roller-coaster ride and TRX fluctuated a lot. Eventually TRX went up and reached 0.0775$ at the end of the week, gaining 1.5% value over a week.
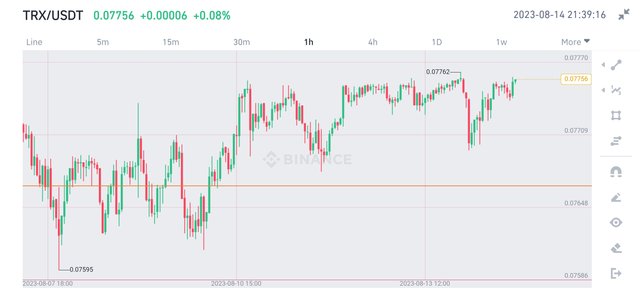
The level, around which TRX fluctuated is 0.0766$. Hovering around this level for almost three days, TRX started to gain momentum. This momentum sustained until TRX reached 0.0775$, which is clearly a strong resistance level.
Getting rejected from that level, TRX fell at first. Then it tried to break that area again, but failed. However, TRX showed strength and hovered around this area for two days. After that, TRX fell to 0.077$.
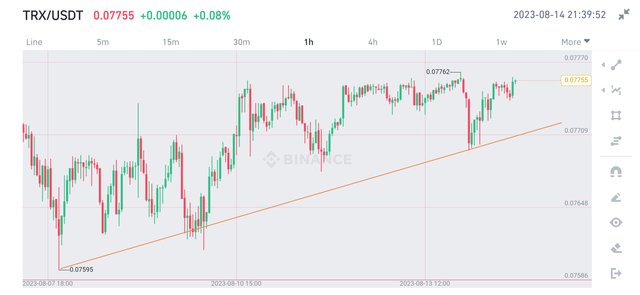
As is shown above, the bullish trendline seems like a important one for TRX. You can see that Tron is following this trendline for almost a week. It is crucial for it to hold onto this line. We may break the resistance if we can do so.
All Screenshots are taken from Binance
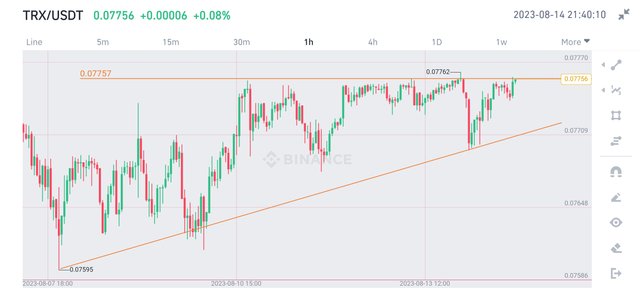
My prediction is that we break the resistance level very soon. But it is important that TRX confirm the break-out with a successful retest. On the other hand, losing the trendline would be bad for TRX.
No words from this article should be taken as financial advice.
VOTE @bangla.witness as witness

OR

https://twitter.com/Arsalaan00070/status/1691132988288049152?t=2qDnqQhZEoD3BKEfiJRjIg&s=19
TRX Value Per Coin Analysis Posted by many valuables. I really liked the topic of your post.
This is a great analysis on trx value per coin, thanks for sharing with us 😊👍