Moving Charts: TRX Value Per Coin Analysis | 10% To @tron-fan-club
Hello and welcome to everyone at the Tron fan club. Today we take a look at TRX and its price movements. Very recently the market has been relatively stable and is actually gaining some pace. Trx has been following the mass trend and the result is reflected in the chart. And as usual, we start from a week ago.

Made with Canva.
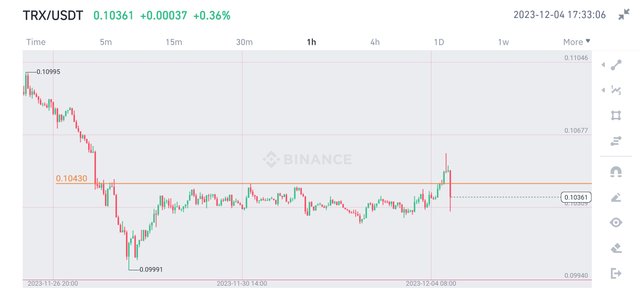
For the last few weeks, TRX has been pretty stable. TRX continued this movement this week also. The week started with TRX falling through the level of 0.104$. TRX then fell back to 0.1$ level and quickly bounced from there.
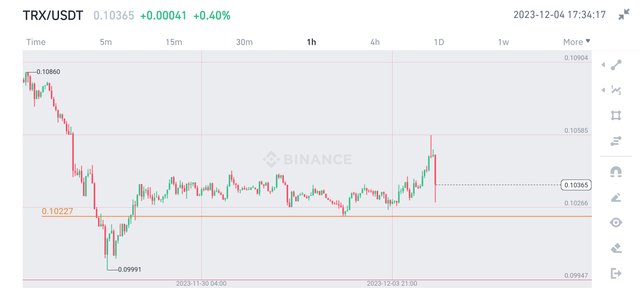
After the bounce, TRX gradually went back to the level of 0.104$. It hovered below this level for a few days. It seemed like TRX was gathering strength. And it really broke that resistance ultimately. However, it seems like the retest was not successful.
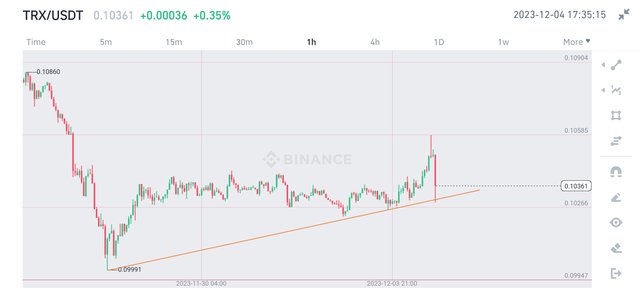
TRX is down 0.6% in a week, which is not that bad. So, TRX needs to hold onto the support zone of 0.10$. Losing this support would push TRX to the lower zones. There is also this bullish trendline that was formed this week. TRX may fall badly if it loses that.
All Screenshots are taken from Binance
My prediction is that we break the resistance level after a little bit of consolidating. But it is important that TRX confirm the break-out with a successful retest. On the other hand, losing the support would be bad for TRX.
No words from this article should be taken as financial advice.
VOTE @bangla.witness as witness

OR

https://twitter.com/Arsalaan00070/status/1731640028718363031?t=uTWo8kaEP0wr_PSMizS18g&s=19
Great analysis on the trx price chart, thanks for sharing it's value per coin
Thanks for sharing you expert analysis of the trx chart. I also hope trx breaks out from the resistance.