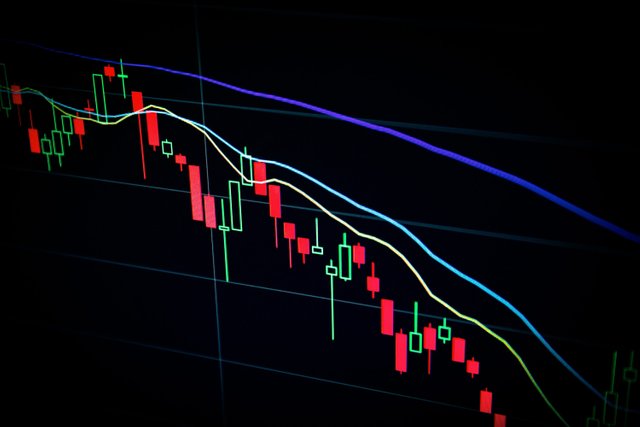
Volume as an indicator of bullish or bearish signal confirmation patterns

Hello dear readers, continuing with the thematic line of yesterday's publication, today I will try to explain in a simple way how to use the volume to have a confirmation of bullish or bearish signal, starting from the two signals that I look for on the charts in my trading operations in the cryptocurrency market, basically what I do is to look for the increase or decrease in volume and thus confirm the strength or weakness of the uptrend or downtrend.
Generally, after the price of a given asset or financial instrument spends prolonged periods of time in a sideways channel or probable accumulation zone, one must be vigilant in monitoring the price.
One of the reasons to be attentive and monitor the price action in sideways zones is basically because, when the price starts to break the upper zone or resistance with force, and if this movement is accompanied by a constant increase in volume, it is taken as a bullish signal confirmation pattern.
A simple way to find a bearish signal using volume as a confirmation indicator is that after the price of a given asset or financial instrument has executed multiple upward movements in waves, and begins to establish a sideways channel or probable distribution zone.
It is important to monitor the price, because when the price starts to break the lower support zone with force, and if this movement is accompanied by a decreasing loss of volume, it is taken as a confirmation pattern of a bearish signal.

SOURCES CONSULTED
Steven N Using Trading Volume to Understand Investment Activity. Link

OBSERVATION:
The cover image was designed by the author: @lupafilotaxia, incorporating image: Vectorvest

