Theoretical and technical generalities of the Aroon Indicator
As I have mentioned in previous posts, technical analysis is vitally important in the world of trading, primarily because it uses elements of the scientific method to record an actual history of price action or market movements, and then uses that data to create charts that are used to evaluate and extrapolate trends in the financial markets.
In this sense, technical analysis is based on the statistical values developed by the price action to create trends, i.e. it is based on a balance between supply and demand, it is worth mentioning that among the key statistical indicators to identify the existence and direction of a trend is the Aroon Indicator.
What is the Aroon indicator?
The biggest problem faced by those of us in the trading world is to determine whether a given market is in an accumulation zone, distribution zone, or if it is in fact in an uptrend or downtrend.
Therefore, having technical tools that allow evaluating the price action and at the same time knowing the market projection, are key elements for any trader, in this sense, it is worth mentioning that the Aroon indicator is one of the technical indicators of reference and probably the most used when identifying the trend of a certain financial instrument.
According to what was explained in the class, the Aroon indicator is very useful in these three scenarios; identifying the existence of a trend, identifying probable trend changes, and measuring the strength of the trend, hence the value of this technical tool, which has been considered among the most accurate indicators when projecting market trends.
It should be emphasized that the Aroon indicator is composed of two lines, the first is known as the ascending line and shows the number of periods from a maximum, and the second descending projection line measures the number of periods from a minimum.
A fact to highlight is that this indicator oscillates on a scale that goes from 0 to 100, and at a technical interpretation level when the value of the ascending line approaches the 100 level it projects a strong bullish inclination, in the same way it happens when the value of the descending line approaches the 100 level in this case it means a strong bearish inclination.
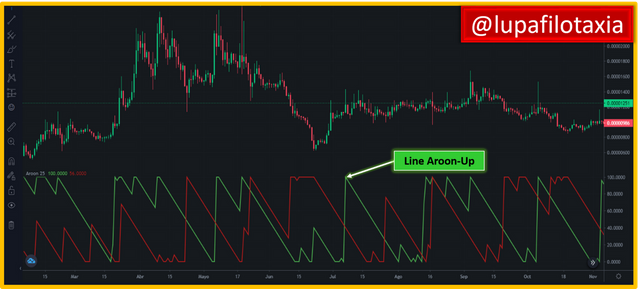
▶ Aroon-Up
As I mentioned earlier the Aroon indicator is composed of two lines, the first is known as Aroon-Up which measures the number of periods since the most recent high of the period (x), in other words, the Aroon-Up line measures the uptrend price movement of an asset and indicates the strength on a scale of 0 to 100, hence the reason why it is associated as an Aroon line.
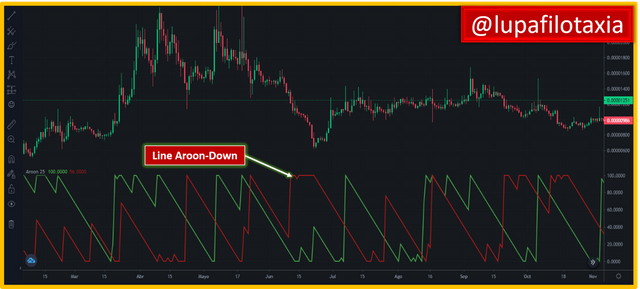
▶ Aroon-Down
In the case of the Aroon-Down line, unlike the first line (Aroon-Up), it measures the number of periods since the most recent low of the period (x), so it is intuitive that the Aroon-Down line measures the strength of the downtrend on a scale from 0 to 100, hence the reason why it is associated as a Negative Aroon line.
In summary, the Aroon indicator provides the ability to identify the existence of a trend, identify likely trend changes, and measure the strength of the trend. In the next post I will describe how Aroon-Up / Aroon-Down is calculated.

SOURCES CONSULTED
AvaTrade Aroon Indicator Trading Strategies. Link
OBSERVATION:
The cover image was designed by the author: @lupafilotaxia, incorporating image: TradingView


@tipu curate 3
Upvoted 👌 (Mana: 0/3) Get profit votes with @tipU :)