Groestlcoin (GRS) Has Completed Bullish Setup For Big Move
Hi friends hope you are doing well. In this article I want to show you my technical analysis on Groestlcoin to understand how it has completed the setup for very big bullish move.
Major announcement:
If we visit the official website of GRS then they have announced major upcoming events on 22nd June 2020 and one of them is its testnet release. Below is the announcement by GRS team on their site:
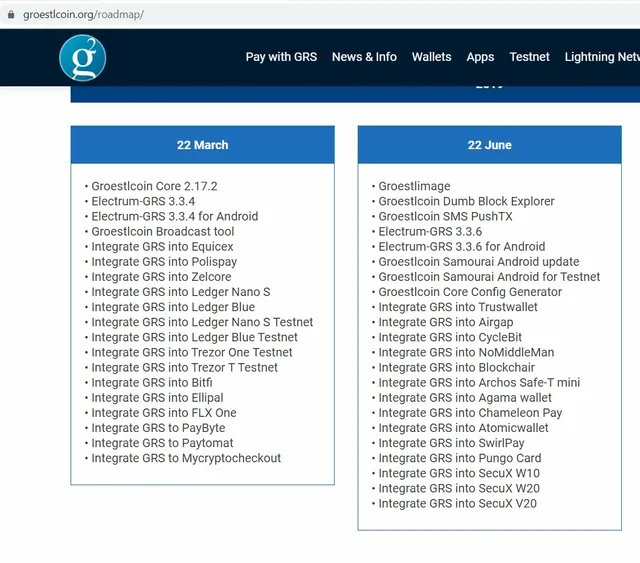 https://www.groestlcoin.org/roadmap/
The coinmarketcal.com added this announcement on 1st May 2020 as below:
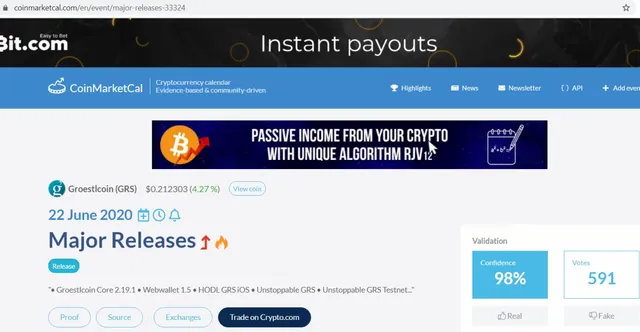 https://coinmarketcal.com/en/event/major-releases-33324
You can also watch below video for better understanding
The major spike:
After when the announcement was added on coinmarketcal.com the price action of the GRS started moving up. If we watch on the weekly chart then GRS was moving in a down channel. And on the candlestick that was started on the 4th May 2020 it was trying to break down the support. But soon it started the bullish rally up to more than 80% from the lowest point up to the highest point.
All indicators gave clear bullish signals before the rally:
Before the bullish rally almost all indicators gave very obvious signals. For example, I have used a combination of five indicators to determine the bullish rally. Then it can be easily observed that on 8th May the moving average convergence divergence (MACD) indicator started turning bullish and the stochastic gave bull cross from oversold zone. Then on 12th May the momentum was started changing from bearish to bullish and finally we received a bullish signal by the directional movement indicator as well because the positive directional indicator (+DI) crossed up the negative directional indicator on 22nd May and then we have witnessed a powerful upward move.
The SMAs are turning bullish:
If we place the simple moving averages with the time period of 25, 50, 100 and 200. Then it can be easily observed that after the strong bullish rally the price action has crossed up all the moving averages. At this time the price action of GRS is crossing up the 200 simple moving average. This time the smallest time period moving average 25 is crossing the 50 simple moving average and the biggest time period moving average with the time period of 200 is above all other moving averages. Once the smallest moving average will be moved above all other moving averages and the biggest time period moving average will be moved below all the other moving averages then a complete opened alligator mouth can be formed by the SMAs that can trigger more powerful bullish move. And before the alligator’s mouth formation we can observe another bullish move when the 50 simple moving average will be crossing up the 200 SMA. Because this golden cross is considered as a powerful buying signal among the traders community and this bull cross between the two moving averages will be a big invitation to the traders to buy GRS.
Harmonic moves with continuation:
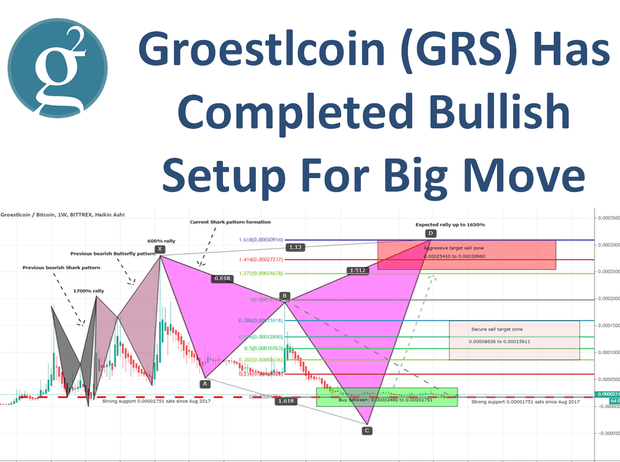
Now let’s move to my favorite part of the analyses and that is the harmonic moves by the price action of GRS. If we switch to the long-term weekly chart then it can be easily seen that the price action is continuously forming different harmonic patterns and all these patterns are bearish. For example 1st the price action formed a bearish Shark pattern and for the completion of final leg it produced more than 1700% bullish rally. Then price action started the formation of bearish Butterfly pattern and while completing the final leg of this butterfly the price action produced more than 600% rally.
At this time the price action is forming another bearish Shark pattern. The formation of this pattern was started from the candlestick that was started on 23rd April 2018. And after the completion of initial leg the price action retraced up to 0.618 Fibonacci level. And this was the first confirmation of bearish Shark. Then B to C leg is projected between 1.13 upto 1.618 Fibonacci projection and this is the second confirmation of Shark. You can observe that on the chart I have placed the pattern up to 1.618 Fib level, but this level is in negative zone therefore it will be not possible for the priceline to enter in the negative zone. I have just placed the pattern up to this level only for educational purpose to show you the perfection of this pattern. However the priceline has found a strong support at 0.00001751 sats. Therefore the potential can be up to this level. Now as per Fibonacci sequence of bearish Shark. The priceline should move between 0.886 up to 1.13 Fibonacci retracement level. And once this leg will be completed then in it can produce up to 1650% big bullish rally. However as per Fibonacci sequence of bearish Shark I have also defined some secure targets as well. The complete buying and sell targets as per Fibonacci sequence are as below:
Buy between:
0.00003480 to 0.00001751 sats
Secure sell target zone:
0.00008636 to 0.0001591 sats
Aggressive target sell zone (Up to the completion of shark's leg)
0.0002541 to 0.0003096 sats
Click here to create free account on tradingview to watch and play the chart on realtime
Conclusion:
As the previous history of GRS it is very easy for the price action to complete the formation of another harmonic pattern and that is almost formed. However, it is not confirmed that this strong bullish move will be started before the testnet release that is announced by the GRS team.
Note: This idea is education purpose only and not intended to be investment advice, please seek a duly licensed professional and do you own research before any investment.
You are invited to post in the Community Banking and Finance.