Crypto Trading With SuperTrend Indicator (Part 2)

Background Image Edited on Photocollege
In line with our previous class which we discussed the Crypto Trading With SuperTrend Indicator (Part 1), I'm delighted to share the part 2 of this course with us today. In today's edition, we will discuss more in-depth on few other topics.
Let's give brief highlights of the various sub-headings we will be discussing in this edition.
Prediction of bullish or bearish trend using SuperTend indicator
Identifying buy/sell signal using SuperTend indicator
We have established in part 1 of this course that the SuperTend indicator is trend-based because it has two different colours which it uses to identify the trend of the indicator at any point in time.
The colour of the indicator tells us the direction of the trend and the market situation at any point in time. We are going to be looking at how to identify both bullish and bearish trends via their different colours. Let's start with the bullish trend.
Bullish Trend
When we talk about the bullish trend, we are referring to the uptrend movement of the price action. In the SuperTrend indicator, the bullish trend is identified with green colour on the indicator located below the price action and acting as dynamic support for the price action. Let's consider the chart below as an example.
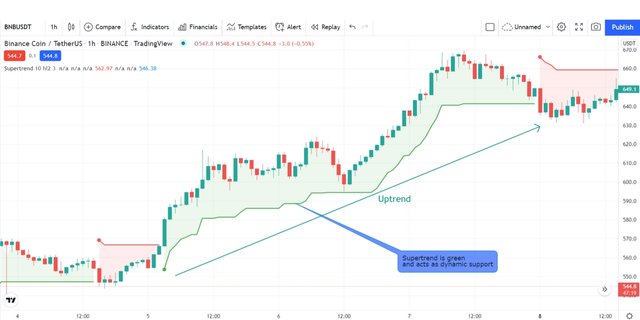
From the above image, you will notice that the indicator is green and seen under the price action. At this point, it acted as dynamic support to the price. This indicates a bullish trend.
Bearish Trend
When we talk about the bearish trend, we are referring to the downtrend movement of the price action. In the SuperTrend indicator, the bearish trend is identified with red colour on the indicator located above the price action and acting as dynamic resistance for the price action. Let's consider the chart below as an example.
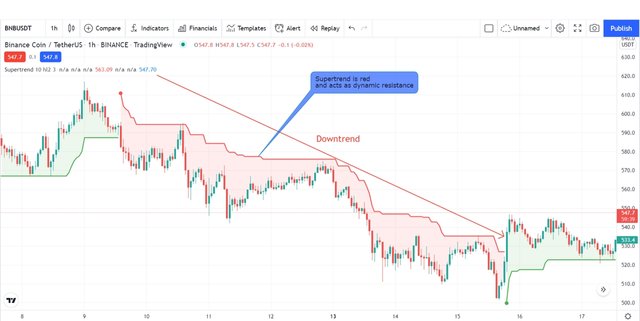
From the above image, you will notice that the indicator is red and seen above the price action. At this point, it acted as dynamic resistance to the price. This indicates a bearish trend.
The SuperTend indicator just like every other indicator can be used to identify the buy/sell signal. As we all know the SuperTend indicator is used to determine the trend direction so also it is used to determine entry and exit positions i.e. the buy entry and the sell entry.
Buy Signal
To place a buy entry, the price of the asset must be in an uptrend direction. The SuperTrend at this point will be seen below the price action which means the colour will be green. When this green surfaces at below-the-price actions and acts as dynamic support, then one can open a buy position at that point.
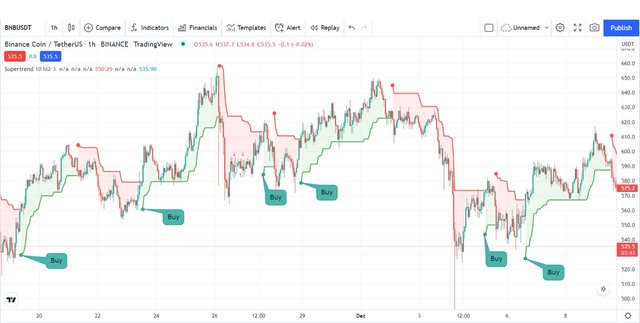
From the above image, we can see the marked position of buy entries as indicated by the SuperTrend indicator. Those positions are positions in which any trader can successfully enter a buy entry.
Sell Signal
To place a sell entry, the price of the asset must be in a downtrend direction. The SuperTrend at this point will be seen in above the price action which means the colour will be red. When this red surfaces above the price actions and acts as dynamic resistance, then one can open a sell position at that point.
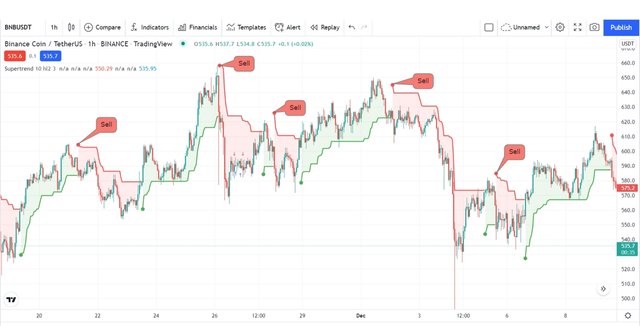
From the above image, we can see the marked position of sell entries as indicated by the SuperTrend indicator. Those positions are positions in which any trader can successfully enter a sell entry.
I do hope you enjoy today's edition of the SuperTrend indicator. I will love to stop here at the moment because I wouldn't want to bore my learners with too much information at once. I have discussed how to identify bullish and bearish trends and I have also discussed how and where to place buy and sell.
In the case of placing an entry or exit position I.e buy and sell entry using the SuperTrend Indicator, I suggest traders be careful and watch until the trend is confirmed by the change in colour. This will enable them to minimize loss and maximize profit.
Note: All screenshots are mine taken from the TradingView website
https://twitter.com/xavierf14044615/status/1662032413986258946?s=20
Congratulations...
Thank you @radjasalman for the support, it is highly appreciated
Thank you for your contribution to the community. Keep on sharing quality original posts and please read our how-to posts which have been pinned in the community.
Nice review, we hope you can maintain a professional quality post if you want to share relevant topics in the Steem Alliance community.
Increase your Engagement in the community to exchange ideas and interact with teams from various communities.
Please always review the posts we have pinned on the community page. There are many guides that you should know, and they will be very useful.
Rating : 7/10
have a nice day!
Thanks for the review dear moderator
Hi @simonnwigwe,
It is innocent post, i appreciate your work. but it is not a suitable place for sharing these types of crypto post here, we will recommend you to join our Tron Fan Club community and publish your crypto base posts here. this community is design for crypto lovers. Next time, please share these types of post in TFC community.
Thank You!