Analyzing BTCUSDST Stochastic RSI Indicator & Support level

Background Image Edited on Canvas
Hello guys,
It's another to analyze a coin and I hope we all are ready for this. It's a good thing that we are seeing a good result in most cases. Today I'm using my strategy to analyze the pair of BTCUSDT on a 4H timeframe.
I want to believe that at this time you may all have understood my strategies perfectly. If you don't understand it and you are reading my post for the first time, don't worry I'm still going to explain it here in this post.
Support and resistance levels are key levels that the market respects very much and that is the reason I always use them as part of my strategy anytime I have the opportunity to analyze a coin.
The market has been bearish over the past few days but after looking at the market this morning, I noticed that the market is going bullish and that is why I am analyzing the pair which I believe moves every other crypto asset.
Signals that made me take the trade
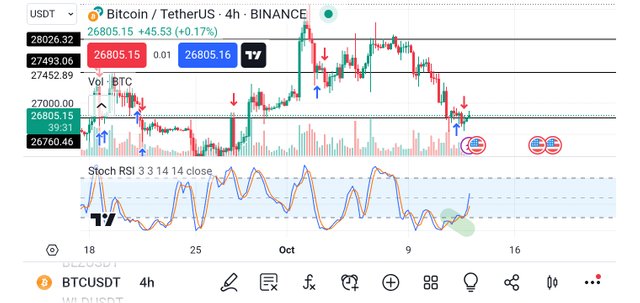
The support level as we can see in the chart above refuses to be broken and the price is already moving up which means that the trend has changed. This was the first signal I got which led me to my decision to enter the market.

Aside from that, I also used one of the indicators that has proven to be more effective for me over the past few days to work to also check and be sure of the signal I was getting.
From the Stochastic RSI Indicator, I have marked a place where the market showed an oversold which implies that the market is about to turn into a bullish move this happens to be the second confirmation I saw from the market which also made me decide to enter the market.

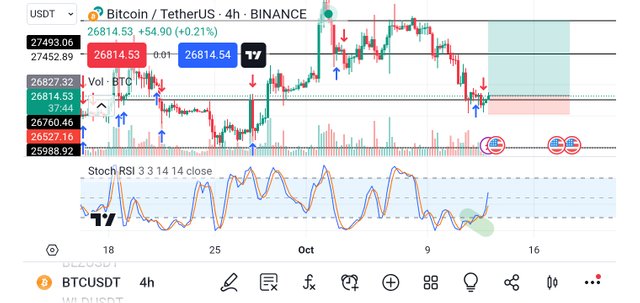
From the above chart, we saw that the blue line is above the orange 🍊 which is a sign of an uptrend market, and seeing that I decided to put on the buy symbol logo as seen above.
My stop loss and the take profit were at the ratio of 1:5 as you can see in the above image. It's a good trade which if it goes in my predicted direction will earn me a good return.
Demo trade of the analysis
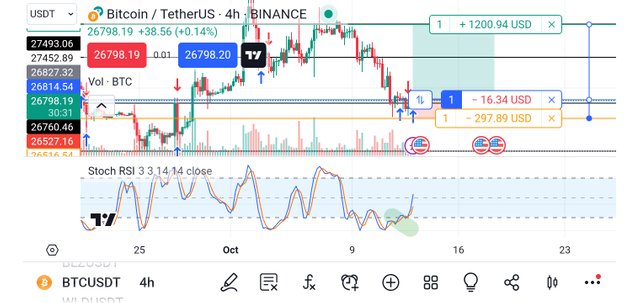
After carefully analyzing the pair, I decided to enter the trade via a demo account in the Trading View platform so that I would be certain of how far the analysis worked.

From the chart above you will notice that I have decided to lose -297.89 USD if the market goes against me for any reason. I'm only an analyst hence sometimes the market may not go as predicted but since it's a demo trade I'm ready to lose that.
For the winning, I will be getting +1200.94 USD if the market goes in my predicted direction which happens to be a very big win, and a reward that will be added to my trading account. This will be a great win not just because of the funds added but because I will be glad that the market respects my strategy.
I have shared with you the trade as I entered it. I will be holding the trade for quite a long time if the market goes in my direction and I will update us all about the profit made in the trade if and only if my stop loss is not hit on time.
Conclusion
I want to believe you all have learned something new from the analysis of the BTCUSDT on the 4H timeframe. The strategy I used is simple that is the support and the Stochastic RSI Indicator. I hope we can use the same in any of the analyses.
Finally, I want to thank you all for reading through my blog today. If you have any questions or contributions, please do well to use the comment section of this post. See you all in my next publication.
Disclaimer: This post is made as an education and not investment advice. Digital asset prices are subject to change. All forms of crypto investment have a high risk. I am not a financial advisor, before jumping to any conclusions in this matter please do your research and consult a financial advisor.
NB: All images except otherwise stated are mine and taken from tradingview.com website
X-share
Dear @simonnwigwe ,
We appreciate your active participation and contributions to our community. To ensure a positive environment for all members, we have implemented a set of guidelines to maintain respectful and constructive discussions while upholding community guidelines.
This is a nice analysis using rsi indicator, let's see how the trade plays out
Now Engage, Connect, and Inspire Each Other to Reach New heights.
Thank You.