Understanding Technical Indicators
-03.jpeg)
Hello friends, welcome back as usual, am very happy to have you back here... Learning never ends like we usually say, am here again to share with you another interesting topic.
From the caption above, I believe you're familiar with the topic but then we would explore it and pick lessons from it. Without mincing words, let get straight into it.
Just few days ago we looked at fundamental analysis and how that it goes beyond some statistical and quantitative analysis to reveal underlying information about a token which then informed our investment decision.
That's is totally excellent but then we need to couple all that we have analysed fundamentally with technical analysis to be balanced.
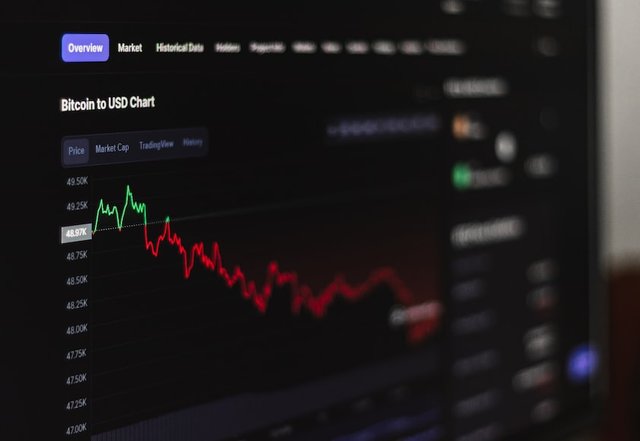
Technical analysis can take advantage of historical data and behaviours of certain asset to predict the future, thereby positioning investors for massive profit.
Technical analysis is very vital especially when you have thoroughly done your homework on F.A, technical analysis will then be like the ice on the cake or even more. What then is technical analysis and how does it work. We will be looking at that in the next section, just scroll down a little.
Technical Analysis which most people fondly call T.A is referred to the process of predicting future market behaviour of an asset by understudying historical data, price action, trends and movements. It employs tools like indicators which help makes the work easy and less complicated.
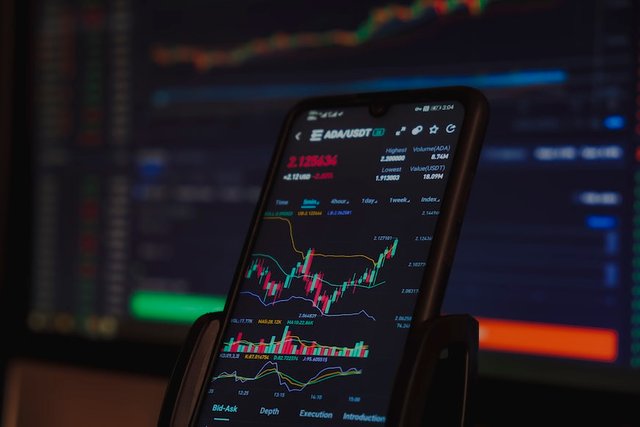
Technical Analysis is carried out by traders to identify trends and movements and fluctuations in the market which in the process reveals to them trading opportunities they can take advantage of. It's important to mention here that Technical Analysis is not limited to crypto alone, it's also applications to other kinds of asset in the stock market.
If am to summarize what T.A does, I would say it studies the demand and supply force in the market using different parameters and tools. There are two major players in the market who are all out to profit from it, we have the buyers and the sellers.
These actors are the ones that influence the market, they are directly and indirectly the cause of the fluctuations, volatility, trends and movements either upward or downwards. They contribute greatly to the cause of different sentiment that occur in the market.
I remembered I mentioned the word tool earlier which is used to carry out technical analysis. I mean to say Technical Indicators, these are powerful tool that were mathematically configured to examine the market and help investors come up with advantageous fact that forms good trading decision. These Indicators includes,
- Simple moving average (SMA)
- Exponential moving average (EMA)
- Bollinger Bands (BB)
- Relative Strength Index (RSI) - Moving average convergence Divergence (MACD) etc.
They help spot all kinds of trends in the market and could also help us identify entry and exit points in the market. I think it's also import to mention that these Indicators are not 100% accurate. You need to back in up with price actions or with two or more indicators or other tested and trusted approach before taking a decision.
- History repeats itself
This is one of the strength of T.A, the assumption here is that trends and patterns that was formed at some point is actually going to resurface again and again. What was down today was actually down sometime ago and when it changes nature to be up today, it means it has been up sometimes before in the market.
- The market discounts everything
This assumption tries to communicate the fact that the price of an asset reflects the happenings in the market. You may and may not not see vividly things influencing the market but the price can always reveal it.
- Price moves in trends
Price moves in trends. This is another factor that gave birth to technical analysis, it's more like the basic logic behind T.A. there will always be trends visible on your chart which in turn help you make wise trading decisions.
Here we go friend, I will love to wrap it just here, so I don't make the information unnecessarily long. There are still more things to share but that should be in the next post.. so do well to watch out for the next.
Like my usual custom is, do well to share your thoughts concerning this piece, you might just want me to add some things or even remove from it. Free free to let me know in he comment section. Gracias!
Disclaimer: This post is made as an education and not investment advice. Digital asset prices are subject to change. All forms of crypto investment have a high risk. I am not a financial advisor, before jumping to any conclusions in this matter please do your own research and consult a financial advisor.
Regards
@lhorgic♥️
Dear @lhorgic ,
We appreciate your active participation and contributions to our community. To ensure a positive environment for all members, we have implemented a set of guidelines to maintain respectful and constructive discussions while upholding community guidelines.
This is a nice post on Technical indicators.
Some other type of indicator include trix Indicator, it would be nice if you add it to your list in case of next time.
Also, I expected to see some Images of these indicators so we can anticipate your next post
Please add it now, thank you!
Now Engage, Connect, and Inspire Each Other to Reach New heights.
Thank You.
Am having issues with my Twitter app, I am trying to use the web version to promote it. Will drop the link here as soon as I get it done...
Thanks for the review @jueco
Twitter link.
https://twitter.com/lhorgic1/status/1680259316194975744?s=20