Introduction To The Zigzag Indicator
The oldest indicator you can think of is Zigzag which has existed for years since the beginning of stock trading. It is an indicator that helps traders to know the highest and lowest price of an asset by marking the two points. Here will be learning more about the zigzag indicator, how you can sport the price movements, and so on.
Zigzag Indicator

Tradingview
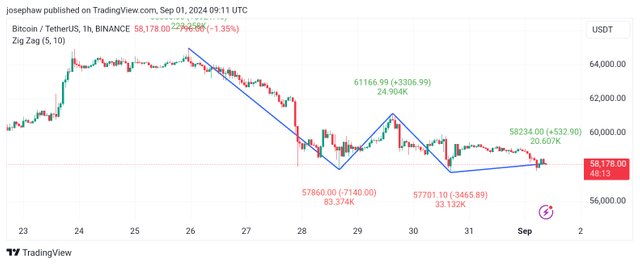
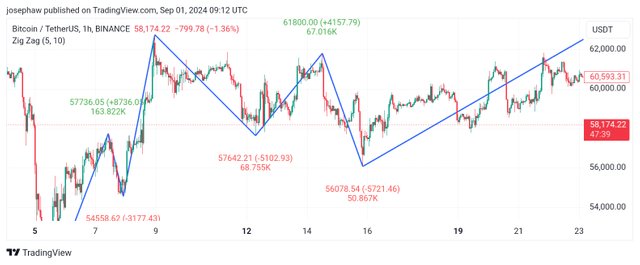
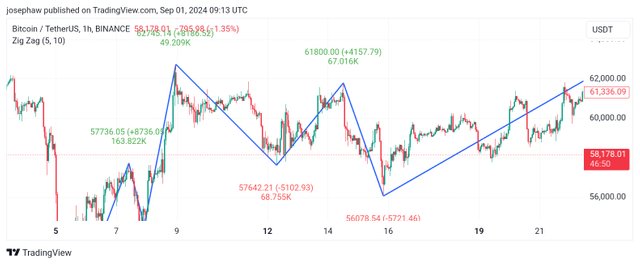
By looking at the chart in which the Zigzag Indicator is displayed you will see that it is an indicator that connects significant points to minimise noise in the market. It connects the top (high) price and bottom (low) price of an asset to minimize the noise of minor price fluctuations of the underlying asset.
The indicator works perfectly by calculating the distance between the highs and lows (price swings) of an asset. Also, it calculates the pullback of an asset and if the pullback is greater than some expected amount, the price movements of the asset have come to an end.

Tradingview
One good thing about the zigzag indicator is that as a trader it helps you to eliminate small price movements automatically without stressing yourself using the indicator to analyze the market can help you to have a clearer picture of how the market is moving.
Calculation
The calculation for Zigzag Indicator is made up of both complex and advanced and you must know the tips behind the indicator besides knowing the given formula below.
Zigzag= (HL, %change = X, retrace = FALSE, LastExtreme = TRUE) if %change >= X, Plot Zigzag
Where:
HL = High low price movement
%change = minimum of price movement in percentage
Retrace = retracement of the previous movement of an absolute change from peak to trough.
LastExtreme = If the extreme price is the same over many periods
To do this you have to follow the few given steps to calculate the Zigzag Indicator.

Tradingview
Selecting a starting point of swing high or swing low.
Identify the next swing low or swing high that is different from that of the starting point.
Draw a trend line from the starting point up to the new point.
Repeat the most recent swing low and swing high.
Settings
Depth, backstep, and deviation are the three settings of the zigzag indicator that you need to take into consideration. However, you can customize the setting to the way it suits you if you don't want to use the default settings.
Depth:
This is the minimal number of candlesticks that won't be seen as a bottom/top of a bottom/top that was already found using deviation.
Backstep:
This is the minimal number of candlesticks that are between the lows or the highs.
Deviation:
This is the minimal distance that is in percentage (%) between the highs and the lows of the two (2) consecutive candlesticks that will make the indicator form a bottom or top.
Disclaimer
Here in this post, we have discussed about zigzag indicator which is an important indicator for identifying the top and low price of an asset we can use the indicator in so many ways. This post is strictly for educational purposes and not as investment advice.
Note:- ✅
Regards,
@jueco
Thank you, friend!


I'm @steem.history, who is steem witness.
Thank you for witnessvoting for me.
please click it!
(Go to https://steemit.com/~witnesses and type fbslo at the bottom of the page)
The weight is reduced because of the lack of Voting Power. If you vote for me as a witness, you can get my little vote.
https://x.com/AkwajiAfen/status/1830173324204183615