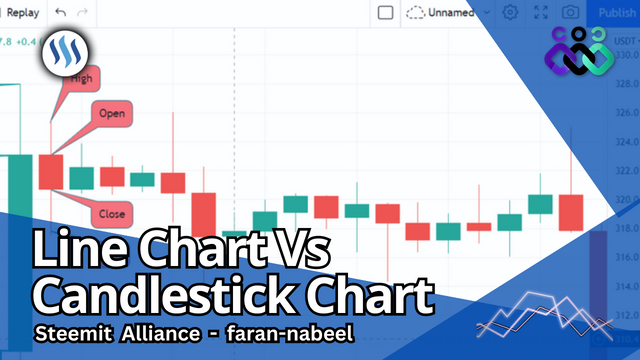
Crypto Lesson - Line Chart Vs Candlesticks Chart - by @faran-nabeel

Hello Everyone, How are you guys? I hope all of my learners and my students will be happy and will be fine by the grace of God. I am also well and blessed by the grace of Allah Almighty. Here, i again back in this alliance community to contribute with my new crypto classes and i come here for discussing about the two charts of crypto. I hope it will be helpful for you.
Here are my friends in which post I am going to discussed about the difference between line chart and candlestick chart. Here in which i will demonstrate that how kine chart is easy and simple from candlestick chart. It is really important to find best method for our technical analysis because iour trade is depend on it. And maybe my all previous lessons will be helpful for all of you.
Difference between Line Chart & Candlestick Chart
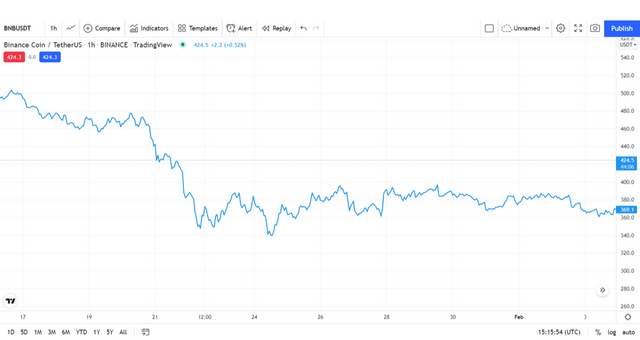
A line chart is just a line that goes up or down depending on the direction of the price of an asset. There are always new data points for different periods but sometimes these data points cannot be identified especially due to the fact that the line has just a single color.

A Line Chart considers just one data point which is the closing price of each period. This makes it less noisy and easy to use especially for higher timeframes when a trader does not need any other data. However, this makes the line chart lack in a couple of aspects.

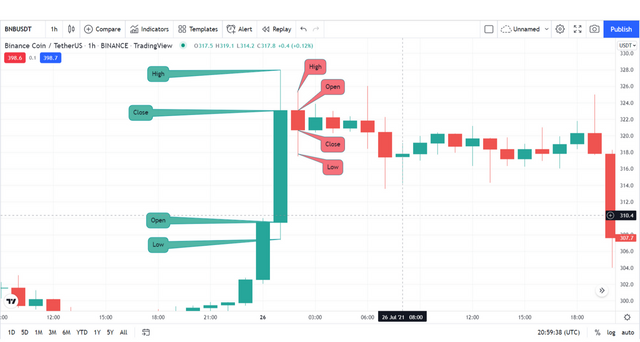
The Candlestick chart is different because it considers the opening price, closing price, high and low of a period. Although this makes it noisy, it provides more details to the trader regarding the behavior and volatility of an asset.

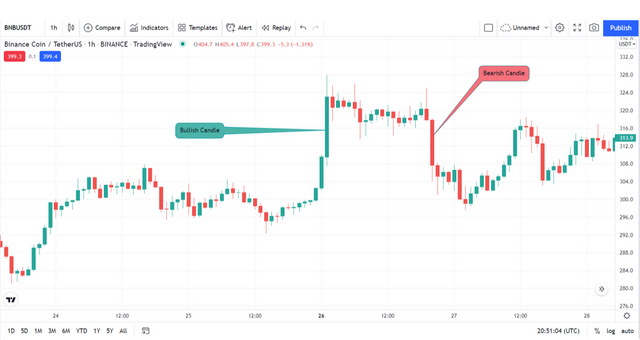
The Candlestick chart, on the other hand, assigns a separate candle to every period in a clear manner. If a candle has a closing price higher than the previous candle, by default it is assigned a green color and termed a bullish candle. Conversely, if a candle has a closing price lower than the previous candle, by default it is assigned a red color and termed a bearish candle.
Conclusion
Now my friends you can see in above about the difference of line chart and candlestick chart. Because my previous lectures are related to line chart and candlestick chart so maybe it also helpful for you. Now in you can practice on both charts this for your trading strategy and you can also determine the support, resistance levels and bullish or bearish trends of crypto market.
Cc, @stephenkendal | rme | steemcurator01 Best Regards to, Faran Nabeel


 |
|---|
https://steemlogin.com/sign/account-witness-vote?witness=stmpak.wit&approve=1
OR
https://steemitwallet.com/~witnesses

Just Write stmpak.wit & Vote 🙂
Thank you, friend!


I'm @steem.history, who is steem witness.
Thank you for witnessvoting for me.
please click it!
(Go to https://steemit.com/~witnesses and type fbslo at the bottom of the page)
The weight is reduced because of the lack of Voting Power. If you vote for me as a witness, you can get my little vote.
Social X Promotion
https://twitter.com/FaranNabeel/status/1713060500731199951?t=Y9Ptz1UzkgWd4K1m5Ab52w&s=19
Upvoted! Thank you for supporting witness @jswit.
Dear @faran-nabeel ,
We appreciate your active participation and contributions to our community. To ensure a positive environment for all members, we have implemented a set of guidelines to maintain respectful and constructive discussions while upholding community guidelines.
Please increase the overall quality of your post, you can do that by adding more contents and quality Images.
Now Engage, Connect, and Inspire Each Other to Reach New heights.
Thank You.
Okay Noted thanks,, 👍